 Back
BackInfrared Spectroscopy and Mass Spectrometry: Principles and Applications
Study Guide - Smart Notes
 Tailored notes based on your materials, expanded with key definitions, examples, and context.
Infrared Spectroscopy and Mass Spectrometry
Introduction to Spectroscopy
Spectroscopy is the study of the interaction between matter and electromagnetic radiation. It is a fundamental tool in organic chemistry for determining molecular structure and identifying functional groups. Most spectroscopic techniques are nondestructive and provide detailed information about molecular orbitals, bonding, and structure.
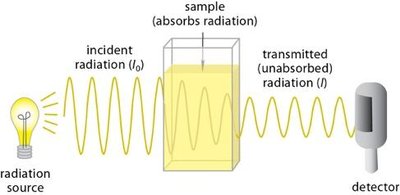
Absorption Spectrometry: Measures the amount of light absorbed by a sample as a function of wavelength.
Spectrum: A graph of radiation absorbed or transmitted versus wavelength or frequency, characteristic of a compound's structure.
Key Methods: Infrared (IR) spectroscopy, Mass Spectrometry (MS), Nuclear Magnetic Resonance (NMR), Ultraviolet-Visible (UV-VIS) spectroscopy.
The Electromagnetic Spectrum
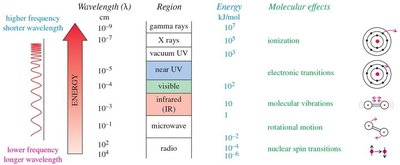
The electromagnetic spectrum encompasses all types of electromagnetic radiation, categorized by wavelength and frequency. Different regions of the spectrum interact with molecules in distinct ways, leading to various molecular effects.
Wavelength (\(\lambda\)): Distance between two peaks of a wave.
Frequency (\(\nu\)): Number of wave cycles passing a point per second.
Energy of a photon: , where is Planck's constant.
Regions: Gamma rays, X-rays, UV, visible, IR, microwave, radio.
The Infrared Region
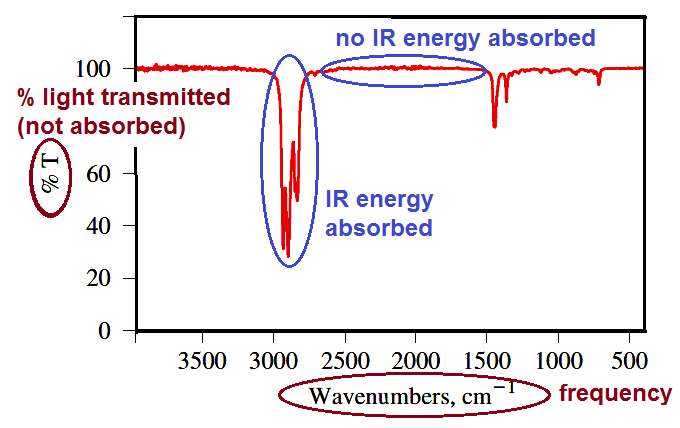
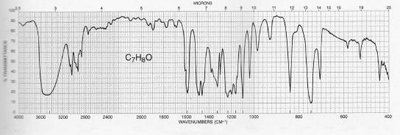
Infrared spectroscopy records the light absorbed by a substance as a function of wavelength. The horizontal axis is typically the wavenumber (\(\tilde{\nu}\)), the inverse of wavelength, measured in cm−1. Wavenumbers are proportional to frequency and energy, and the vertical axis is percent transmittance.
Wavenumber:
Percent transmittance: 100% if no absorption occurs.
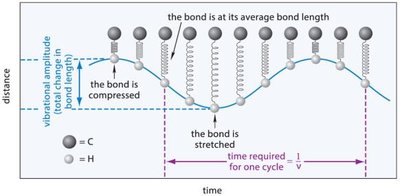
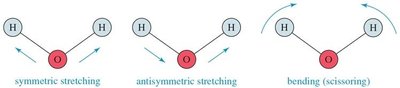
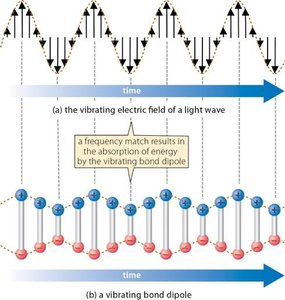
Molecular Vibrations
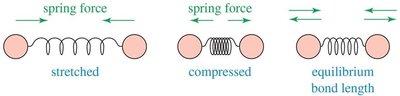
Molecular vibrations are central to IR spectroscopy. When a bond is stretched or compressed, a restoring force acts to return the atoms to their equilibrium bond length. These vibrations absorb specific frequencies of IR radiation.
Bond stretching: Restoring force pulls atoms together when stretched, pushes apart when compressed.
Vibrational modes: Nonlinear molecule with atoms has fundamental vibrational modes.
Frequency: Decreases with increasing atomic mass, increases with increasing bond energy.
Types of Vibrational Modes
Stretching: Symmetric and antisymmetric stretching.
Bending: Scissoring, rocking, wagging, and twisting.
IR Spectroscopy Spectra
Each molecular vibration absorbs a particular frequency of IR radiation, resulting in characteristic peaks in the IR spectrum. The spectrum is a plot of energy absorption versus frequency.
IR and Chemical Structure
IR peaks correspond to the absorption of energy by the vibration of specific bonds or functional groups. Each functional group absorbs in a characteristic region, making IR spectroscopy a powerful tool for identification.
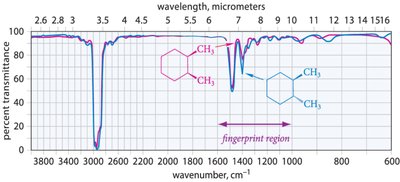
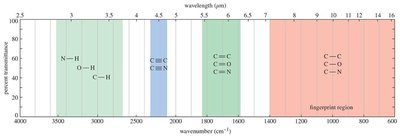
Functional group region: 3500–2800 cm−1 (O–H, N–H, C–H stretching), 2250–2100 cm−1 (C≡N, C≡C stretching), 1850–1600 cm−1 (C=O, C=N, C=C stretching).
Fingerprint region: 1400–600 cm−1 (complex bending and stretching).
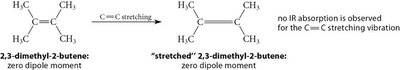
IR-Active and IR-Inactive Vibrations
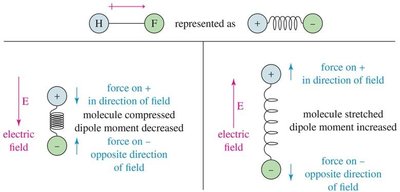
Only bonds with a dipole moment interact with the electric field of IR light and are IR-active. Bonds without a dipole do not absorb IR light and are IR-inactive.
Polar bonds: IR-active, absorb IR radiation.
Nonpolar bonds: IR-inactive, do not absorb IR radiation.
Measurements of the IR Spectrum
Modern IR spectrometers, such as Fourier Transform Infrared (FT-IR) spectrometers, measure all frequencies simultaneously, improving sensitivity and reducing analysis time.
Infrared Spectroscopy of Hydrocarbons
The position and intensity of IR absorption peaks depend on bond strength, atomic masses, and the type of vibration. Stronger bonds and lighter atoms absorb at higher frequencies.
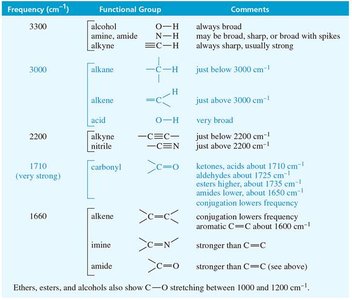
Bond stretching frequencies: See table below for typical values.
Peak intensity: Related to sample concentration and dipole moment.
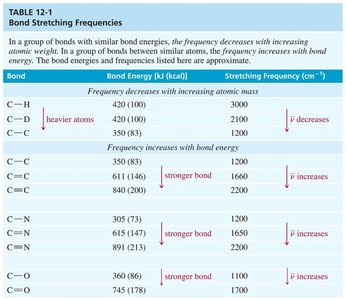
Carbon-Carbon and Carbon-Hydrogen Bond Stretching
C–C: 1200 cm−1
C=C: 1660 cm−1 (conjugation lowers frequency)
C≡C: <2200 cm−1
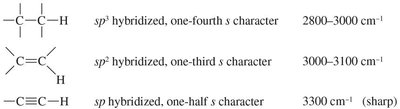
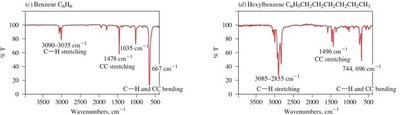
C–H: 2850–2960 cm−1 (alkane), 3000–3100 cm−1 (alkene), 3300 cm−1 (alkyne)
Characteristic IR Spectra of Hydrocarbons
Alkanes, alkenes, and alkynes show distinct IR absorption patterns based on their functional groups and bond types.
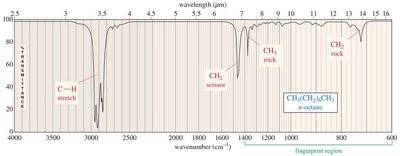
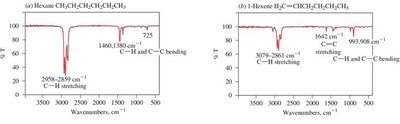
Alkanes: C–H stretching (2850–2960 cm−1), C–H bending (fingerprint region).
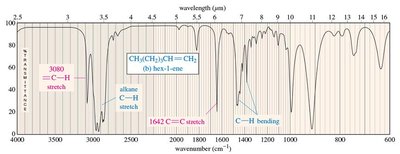
Alkenes: C=C stretching (1640–1680 cm−1), sp2 C–H stretching (3000–3100 cm−1).
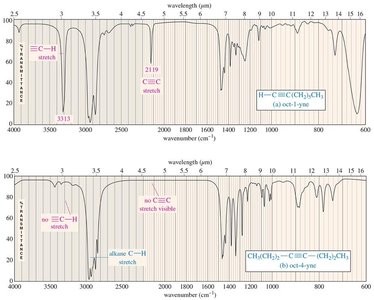
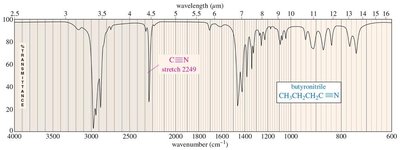
Alkynes: C≡C stretching (~2200 cm−1), sp C–H stretching (>3100 cm−1).
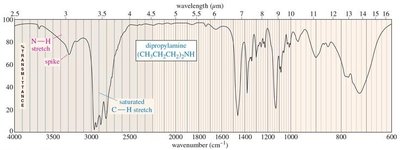
Characteristic Absorptions of Alcohols and Amines
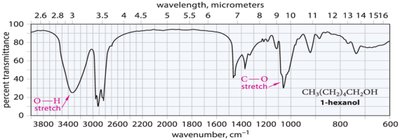
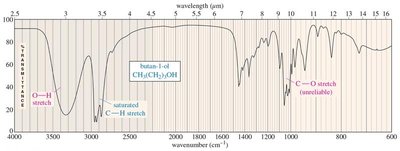
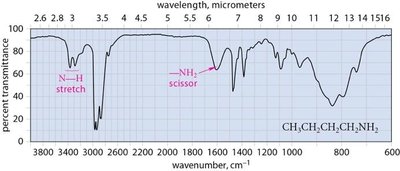
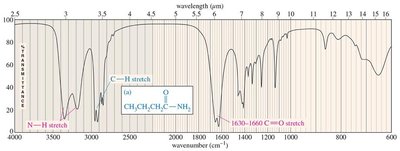
Alcohols and amines exhibit characteristic O–H and N–H stretching absorptions around 3300 cm−1. The shape and number of peaks help distinguish between primary, secondary, and tertiary amines.
Alcohols: O–H stretching (broad, 3300 cm−1), C–O stretching (1050–1200 cm−1).
Amines: N–H stretching (3300 cm−1), primary (2 peaks), secondary (1 peak), tertiary (no peak).
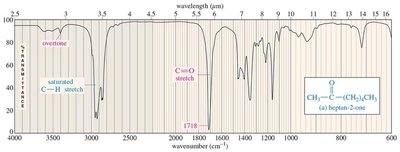
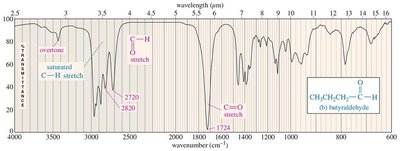
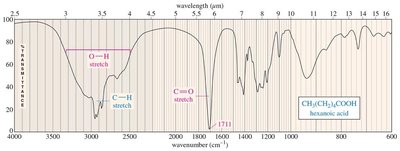
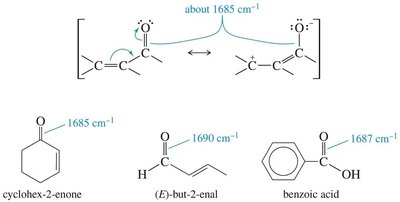
Characteristic Absorptions of Carbonyl Compounds
Carbonyl groups (C=O) in ketones, aldehydes, carboxylic acids, esters, and amides absorb strongly in the IR spectrum, typically around 1710 cm−1. Conjugation and ring strain can shift these frequencies.
Ketones: C=O stretch (~1710 cm−1).
Aldehydes: C=O stretch (~1724 cm−1), C–H signals (2700, 2800 cm−1).
Carboxylic acids: Broad O–H stretch (2500–3500 cm−1), C=O stretch (~1711 cm−1).
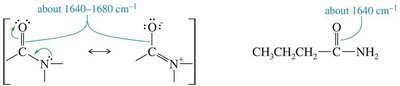
Amides: C=O stretch (1640–1680 cm−1), N–H stretch (3300 cm−1).
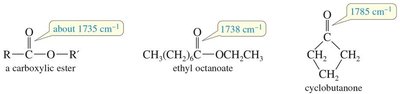
Esters: C=O stretch (~1735 cm−1).
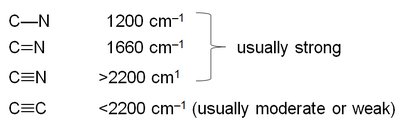
Characteristic Absorptions of C–N Bonds
C–N bonds absorb in similar regions as C–C bonds but are more polar, resulting in stronger absorptions. Typical frequencies are 1200 cm−1 (C–N), 1660 cm−1 (C=N), and >2200 cm−1 (C≡N).
Summary of IR Absorptions
The table below summarizes the typical IR stretching frequencies for common functional groups.
Reading and Interpreting IR Spectra
Interpreting IR spectra involves identifying characteristic peaks and matching them to functional groups. The fingerprint region provides unique patterns for individual molecules.
Mass Spectrometry
Introduction to Mass Spectrometry
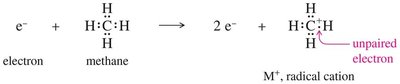
Mass spectrometry (MS) is used to determine the molecular weight and formula of a compound. Unlike IR, MS destroys the sample but requires only minute quantities. The most common method is electron-ionization (EI-MS).
Electron-ionization: Sample is vaporized and bombarded with high-energy electrons, producing radical cations (molecular ions).
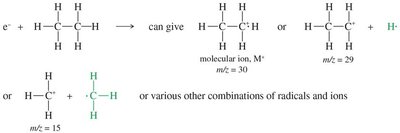
Fragmentation: C–C or C–H bonds break, producing detectable positive fragments.
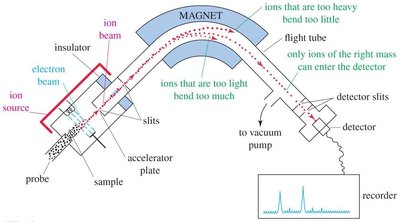
Mass Spectrometer Diagram
Mass spectrometers separate ions by magnetic deflection. The abundance of ions of each mass is plotted, and only cations are detected.
Base peak: Tallest peak, assigned 100% abundance.
Molecular ion (M+): Corresponds to the molecular weight of the original molecule.
Determination of Molecular Formula by Mass Spectrometry
High-resolution MS can distinguish between compounds with similar masses. Isotopic patterns (e.g., 13C, 79Br/81Br, 32S/33S/34S) provide additional information about molecular composition.
Fragmentation Patterns in Mass Spectrometry
Fragmentation produces resonance-stabilized cations whenever possible. Alkanes, alkenes, aromatic compounds, alcohols, ethers, and amines each show characteristic fragmentation patterns.
Alkanes: Fragment at branched carbons.
Alkenes: Fragment to give allylic cations.
Aromatic compounds: Produce benzylic cations.
Alcohols: Often lose water, undergo α-cleavage.
Ethers and amines: α-cleavage and loss of alkyl groups.
Even/Odd Electron Fragments and Mass
C, H, O, X: Even molecular weights, odd-numbered fragments.
Nitrogen: Odd molecular weight, even-numbered fragments.
Ketones and aldehydes: Cleave at carbonyl carbon to form acylium ion.
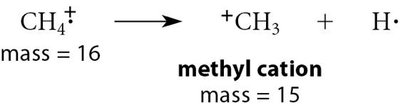
Example: Fragmentation of methane produces methyl cation (m/z = 15) and hydrogen radical.
Additional info: These notes provide a comprehensive overview of IR spectroscopy and mass spectrometry, including principles, characteristic absorptions, and interpretation of spectra, suitable for exam preparation in organic chemistry.
