 Back
BackNuclear Magnetic Resonance (NMR) Spectroscopy: Principles and Applications in Organic Chemistry
Study Guide - Smart Notes
 Tailored notes based on your materials, expanded with key definitions, examples, and context.
Nuclear Magnetic Resonance (NMR) Spectroscopy
Introduction to NMR Spectroscopy
NMR spectroscopy is a fundamental analytical technique in organic chemistry, used for elucidating the structure of organic compounds. It provides detailed information about the connectivity of atoms, the types of functional groups present, and the chemical environment of nuclei such as 1H and 13C.
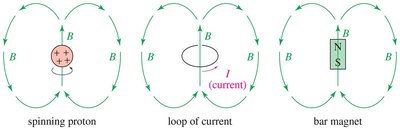
NMR studies the interaction between electromagnetic radiation and the nucleus of an atom.
Only nuclei with odd atomic or mass numbers (e.g., 1H, 13C, 15N, 19F, 31P) are NMR-active.
These nuclei behave as tiny magnets due to their magnetic moment.
NMR is essential for determining functional groups and atom connectivity in organic molecules.
Principle of NMR Spectroscopy
NMR involves placing a sample in a strong magnetic field and irradiating it with radiofrequency energy. The nuclei absorb energy at specific frequencies, which is detected and translated into an NMR spectrum.
NMR spectrum: A graphical representation of the absorption of energy by nuclei in a compound.
The spectrum reveals the number and types of nuclei present, their chemical environment, and their interactions with neighboring atoms.
NMR Instrumentation
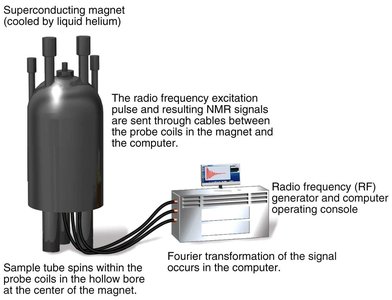
NMR spectrometers consist of a superconducting magnet, probe coils, and a computer for data processing. The sample is placed in a tube at the center of the magnet, and the resulting signals are processed to generate the spectrum.
Superconducting magnets are cooled by liquid helium for high field strength.
Modern NMR spectrometers operate at various frequencies (e.g., 600 MHz, 800 MHz).

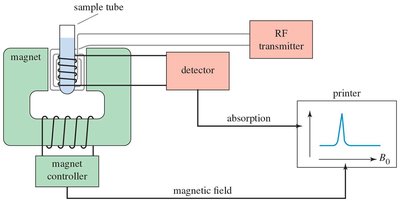
Acquiring an NMR Spectrum
The process of acquiring an NMR spectrum involves placing the sample in the magnet, sending radiofrequency signals, and interpreting the resulting data.
The sample tube spins within the probe coils.
Radiofrequency excitation and signal detection occur in the magnet.
Fourier transformation of the signal is performed by the computer.
1H NMR Spectroscopy
Characteristics of 1H NMR Spectrum
1H NMR provides information about the number and types of protons in a compound, their chemical environment, and their interactions with neighboring protons.
Number of signals: Indicates the number of distinct proton environments.
Location (chemical shift): Shows how shielded or deshielded a proton is.
Intensity (integration): Proportional to the number of protons of that type.
Splitting (multiplicity): Reveals the number of protons on adjacent atoms.

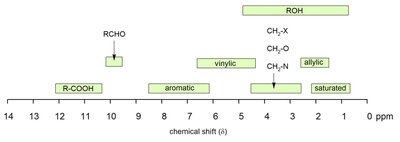
Chemical Shift
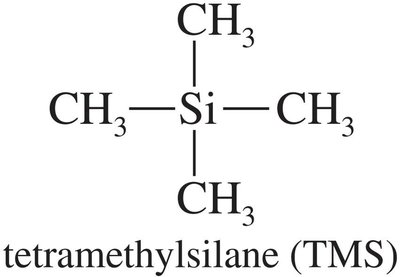
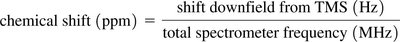
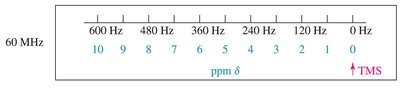
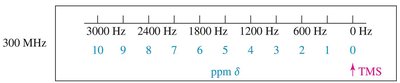
The chemical shift is the position of a signal along the x-axis of an NMR spectrum, measured in parts per million (ppm). It is referenced to tetramethylsilane (TMS), which appears at 0 ppm.
Chemical shift (δ) is calculated as:
Typical Chemical Shift Values
Chemical shifts are influenced by the proximity to electronegative atoms and unsaturated groups. The normal range for 1H NMR is 0–14 ppm.
Reference compound: TMS (tetramethylsilane).
NMR solvents should not contain protons.
Hydrogen bonding and concentration affect the chemical shift of acidic protons.
Chemical Shift Equivalence
Protons in identical environments have the same chemical shift and produce a single NMR signal. Symmetry in the molecule can reduce the number of signals observed.
Example: In 1,2-dibromoethane, equivalent protons give one signal.

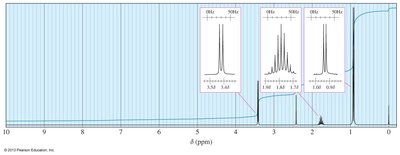
Integration
The area under each signal in a 1H NMR spectrum is proportional to the number of hydrogen atoms producing that signal. Integration helps determine the ratio of different types of protons.
Integration values are used to deduce the number of protons in each environment.

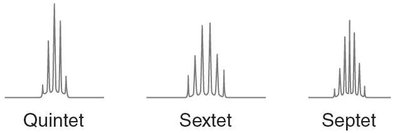
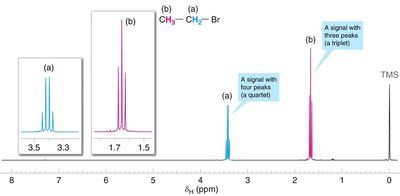
Multiplicity (Splitting Pattern)
Multiplicity describes the splitting of NMR signals due to interactions with neighboring protons. The number of peaks in a signal is determined by the number of nonequivalent hydrogens on adjacent carbons.
Multiplicity is given by the formula: , where is the number of adjacent hydrogens.
Common patterns: singlet, doublet, triplet, quartet, etc.
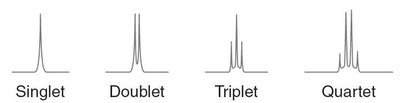
Examples of Multiplicity
Multiplicity can be observed in compounds such as 3-methyl-2-butanone and ethanol, where the splitting patterns correspond to the number of neighboring protons.
Interpretation of splitting patterns aids in structure determination.
Interpreting 1H NMR Spectra
Steps for Structure Elucidation
Interpreting NMR spectra involves several steps to deduce the structure of an unknown compound:
Determine the degree of unsaturation using the formula:
Analyze the number of NMR signals and integration for molecular symmetry.
Interpret splitting patterns to determine neighboring protons.
Draw molecular fragments matching the shift, integration, and multiplicity.
Correlate shifts with possible fragments using chemical shift tables.
Assemble fragments into a complete structure.
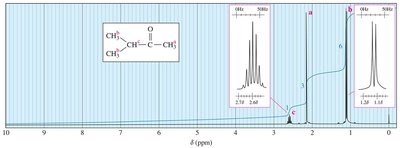
Example Problem: C3H7Br
Given the molecular formula C3H7Br, analyze the NMR spectrum to predict the structure:
Assign chemical shifts, integration, and multiplicity to each proton environment.
Interpret the meaning of each signal.
Coupling Constants and Complex Splitting
Coupling Constants (J)
The coupling constant is the distance between the peaks of a multiplet, measured in Hz. It is independent of the external field strength and provides information about the spatial relationship between protons.
Multiplets with the same coupling constants may arise from adjacent groups of protons.
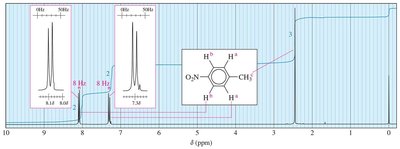
Typical values: cis (10 Hz), trans (15 Hz), geminal (2 Hz), ortho (8 Hz), meta (2 Hz), allylic (6 Hz).
Complex Splitting
Complex splitting occurs when a proton is coupled to more than one set of nonequivalent protons, resulting in multiplets with different coupling constants.
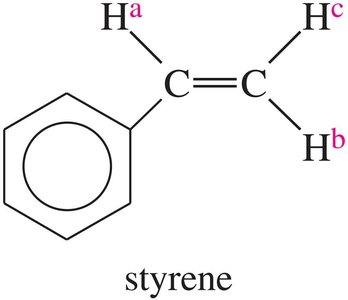
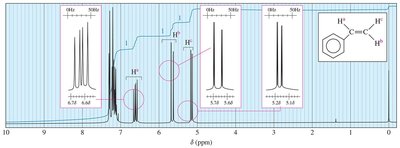
Example: In styrene, Ha is split by Hb (trans, J = 17 Hz) and Hc (cis, J = 11 Hz).
13C NMR Spectroscopy
Decoupled 13C NMR
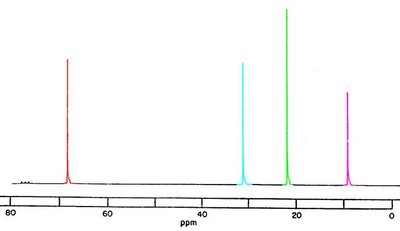
13C NMR provides information about the number and types of carbon atoms in a compound. Decoupled spectra show only the number of distinct carbon environments.
The number of signals indicates the number of different kinds of carbon.
Chemical shifts indicate the type of functional group.
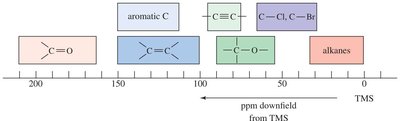
Carbon NMR Chemical Shift Values
Chemical shifts for 13C signals are affected by shielding and deshielding, similar to 1H NMR. Typical ranges are provided for various functional groups.
Alkanes: 0–50 ppm
Aromatic C: 100–150 ppm
Carbonyl C: 150–200 ppm

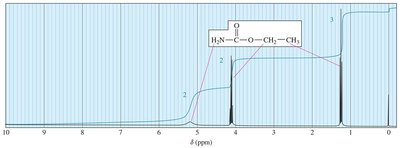
NMR Spectra of Functional Groups
Examples of NMR Spectra for Functional Groups
NMR spectra can be used to identify functional groups such as aldehydes, ketones, carboxylic acids, esters, and amines.
Each functional group has characteristic chemical shift values in both 1H and 13C NMR.


Applications of NMR: MRI (Magnetic Resonance Imaging)
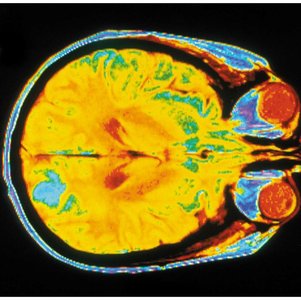
Magnetic Resonance Imaging (MRI)
NMR principles are applied in MRI, a noninvasive diagnostic tool for medical imaging. MRI uses the same basic physics as NMR spectroscopy to generate detailed images of soft tissues.
"Nuclear" is omitted from the name due to public concerns about radioactivity.
A computer assembles 3-D images from multiple slices.
Tumors and other abnormalities are readily detected.
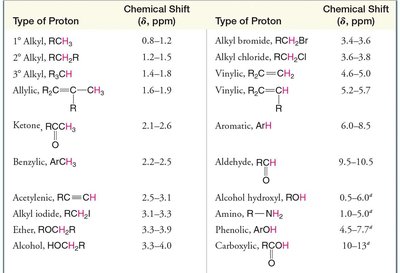
Summary Table: Typical 1H NMR Chemical Shifts
Type of Proton | Chemical Shift (δ, ppm) |
|---|---|
1° Alkyl, RCH3 | 0.8–1.2 |
2° Alkyl, R2CH2 | 1.2–1.5 |
3° Alkyl, R3CH | 1.4–1.8 |
Allylic, R2C=CR–CH3 | 1.6–2.0 |
Ketone, RC(O)CH3 | 2.1–2.6 |
Benzyl, ArCH3 | 2.2–2.6 |
Acetylenic, RC≡CH | 2.5–3.1 |
Alcohol, HOCH2R | 3.3–4.0 |
Alkyl bromide, RCH2Br | 3.4–3.6 |
Vinylic, R2C=CH2 | 4.6–5.6 |
Aromatic, ArH | 6.0–8.5 |
Aldehyde, RCH(O) | 9.5–10.5 |
Alcohol hydroxy, ROH | 0.5–6.0 |
Amino, R–NH2 | 1.0–5.0 |
Carboxylic, RCOOH | 10–13 |
Additional info: This table summarizes typical chemical shift values for various proton environments, aiding in the identification of functional groups in organic compounds.
----------------------------------------
