Skip to main content
Psychology
My Course
Learn
Exam Prep
AI Tutor
Study Guides
Flashcards
Explore
Try the app
My Course
Learn
Exam Prep
AI Tutor
Study Guides
Flashcards
Explore
Try the app
Back
Evaluating Research Findings definitions
You can tap to flip the card.
Descriptive Statistics
You can tap to flip the card.
👆
Descriptive Statistics
Summarizes data using values that represent typical scores and the spread of responses within a dataset.
Track progress
Control buttons has been changed to "navigation" mode.
1/15
Related flashcards
Related practice
Recommended videos
Evaluating Research Findings quiz #1
Evaluating Research Findings
10 Terms
Evaluating Research Findings
2. Psychology Research
7 problems
Topic
Nicole
APA Formatting - References
2. Psychology Research
7 problems
Topic
Nicole
2. Psychology Research
5 topics
14 problems
Chapter
Nicole
Guided course
00:58
Evaluating Research Findings Example 2
560
views
2
rank
Guided course
04:17
Correlation Does Not Equal Causation
551
views
4
rank
Guided course
03:23
Inferential Statistics
566
views
1
rank
Terms in this set (15)
Hide definitions
Descriptive Statistics
Summarizes data using values that represent typical scores and the spread of responses within a dataset.
Mean
Represents the average value in a dataset, calculated by dividing the sum of all values by the number of values.
Median
Identifies the central value in an ordered dataset, unaffected by extreme scores or outliers.
Mode
Indicates the most frequently occurring value in a dataset; some datasets may have none or multiple.
Outlier
A value significantly higher or lower than others in a dataset, which can distort the mean.
Measures of Variability
Quantifies how spread out or clustered data points are within a dataset.
Range
Shows the difference between the highest and lowest values, reflecting overall data spread.
Standard Deviation
Indicates the average distance of each data point from the mean, with higher values showing more spread.
Correlation
Describes the direction and strength of a relationship between two variables, without implying causation.
Correlation Coefficient
A numerical value, often Pearson’s r, quantifying the strength and direction of a relationship between variables.
Temporal Precedence
Refers to knowing which variable occurred first, necessary for establishing causation.
Third-Variable Problem
Occurs when an unmeasured factor explains the relationship between two variables in a correlation.
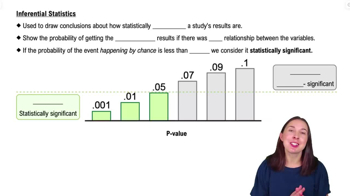
Inferential Statistics
Assesses the likelihood that research findings are due to chance, supporting generalization to a population.
P-value
Represents the probability that observed results happened by chance; values below 0.05 indicate significance.
Statistical Significance
Indicates that research results are unlikely to have occurred by chance, typically when p < 0.05.
 BackBack

 00:58
00:58