Skip to main content
Sociology
My Course
Learn
AI Tutor
Study Guides
Flashcards
Explore
Try the app
My Course
Learn
AI Tutor
Study Guides
Flashcards
Explore
Try the app
Back
Understanding Research Findings definitions
You can tap to flip the card.
Central Tendency
You can tap to flip the card.
👆
Central Tendency
Numbers that summarize the most typical values in a dataset, helping to describe the overall pattern of the data.
Track progress
Control buttons has been changed to "navigation" mode.
1/15
Related flashcards
Recommended videos
Understanding Research Findings quiz
Understanding Research Findings
15 Terms
Guided course
00:56
Understanding Research Findings Example 2
78
views
2
rank
Guided course
04:31
Correlations
102
views
1
rank
Guided course
03:53
Correlation and Causation
129
views
1
rank
Terms in this set (15)
Hide definitions
Central Tendency
Numbers that summarize the most typical values in a dataset, helping to describe the overall pattern of the data.
Mean
The average value in a dataset, calculated by adding all values and dividing by the total number of values.
Median
The middle value in a dataset when values are arranged in numerical order, unaffected by extreme values.
Mode
The most frequently occurring value in a dataset; a dataset can have none, one, or multiple of these.
Outlier
An unusually high or low value in a dataset that can distort statistical measures like the mean.
Descriptive Statistics
Numbers or calculations that summarize and describe the main features of a dataset.
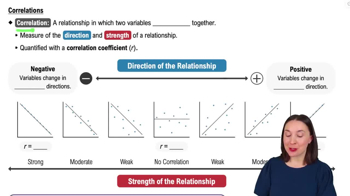
Correlation
A relationship where two variables change together, indicating direction and strength but not causality.
Correlation Coefficient
A numerical value, often symbolized as r, that quantifies the direction and strength of a relationship between variables.
Direction
Indicates whether variables move in the same or opposite ways, described as positive or negative.
Strength
Describes how closely two variables are related, ranging from weak (near zero) to strong (near one).
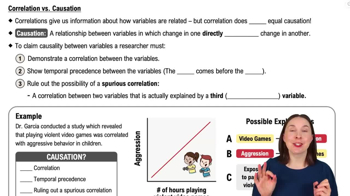
Causation
A relationship where a change in one variable directly produces a change in another, requiring specific evidence.
Temporal Precedence
The requirement that one variable occurs before another to establish a cause-and-effect relationship.
Spurious Correlation
An apparent relationship between two variables that is actually caused by a third, unaccounted-for variable.
Intervening Variable
A third factor that influences both variables in a correlation, potentially explaining the observed relationship.
Frequency Chart
A visual representation showing how often each value appears in a dataset, useful for spotting patterns like the mode.
 BackBack
 00:56
00:56