Bar Graphs and Pareto Charts
- Download the worksheet to save time writing
- Start solving the practice problems
- If you're stuck, watch the video solutions
- See your summary to get more insights

Bar Graphs and Pareto Charts
4 problems
Problem 1Multiple Choice
A bar graph shows the number of books sold by a bookstore in four months:
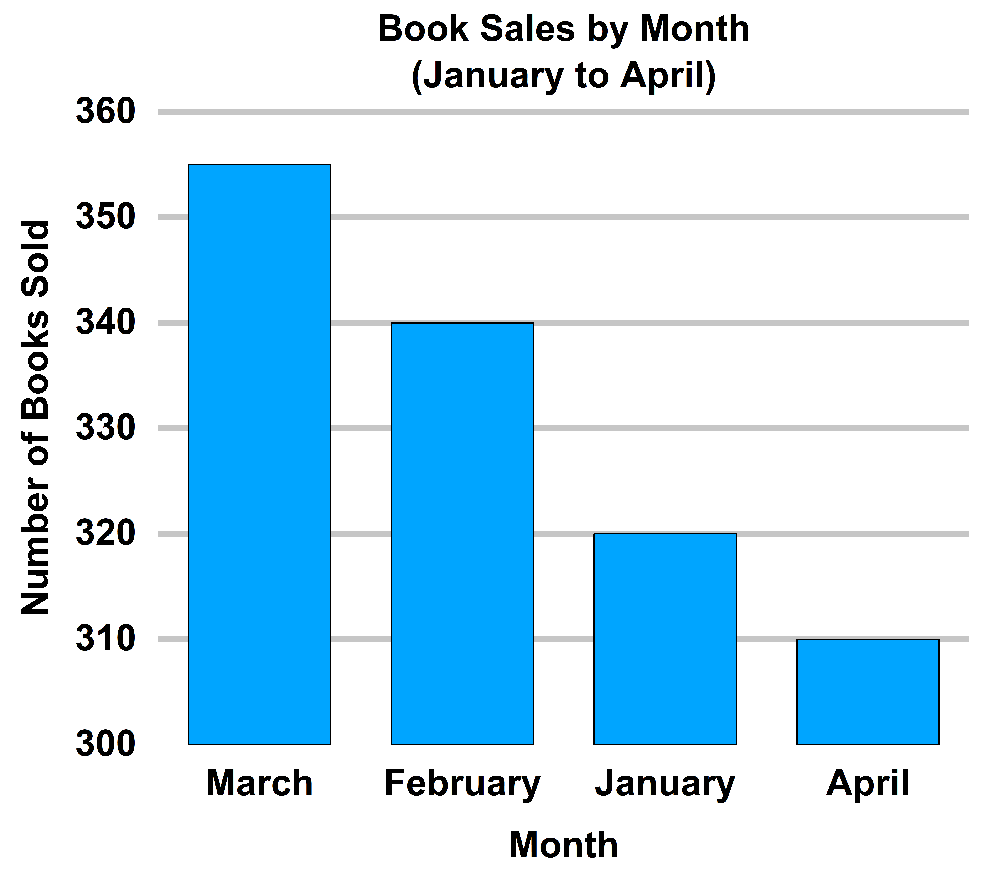
Why is this graph misleading? How should the graph be redrawn to avoid misrepresentation?
Problem 2Multiple Choice
The graph displays the number of students enrolled in Science and Arts majors at a university.
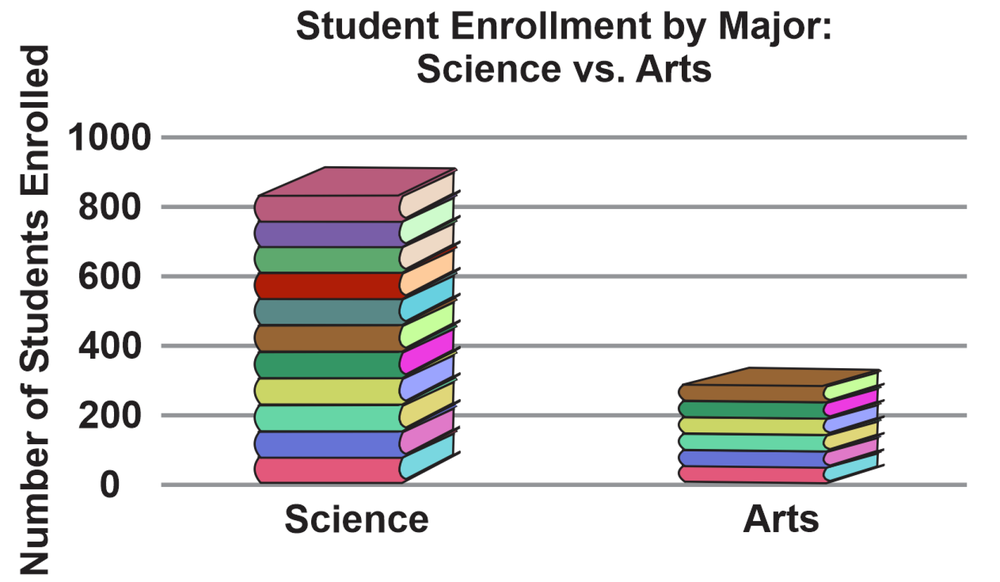
Explain why this graph is misleading. Describe how you would redraw the graph to accurately represent the data.