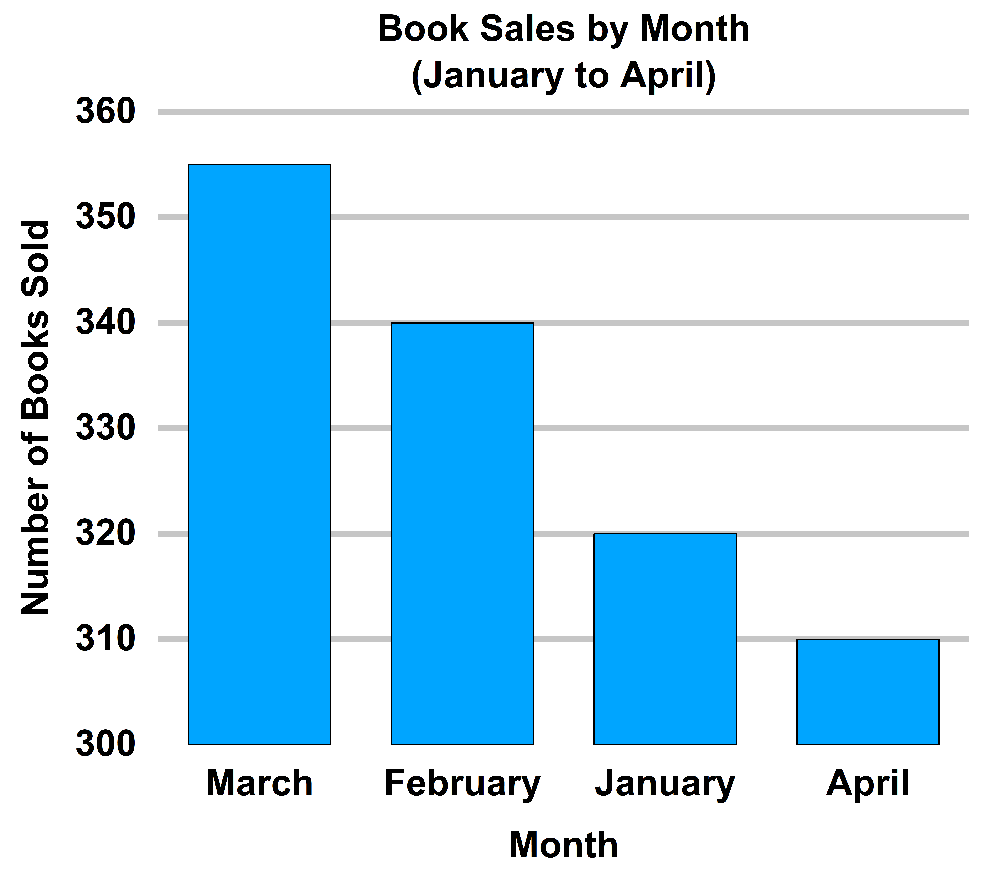
This graph is misleading because the -axis does not start at , and the months are not arranged in order of increasing sales.
The -axis of the graph should start at to accurately represent the differences in the number of books sold. The months should be arranged in order of increasing sales to make the graph look more visually appealing.