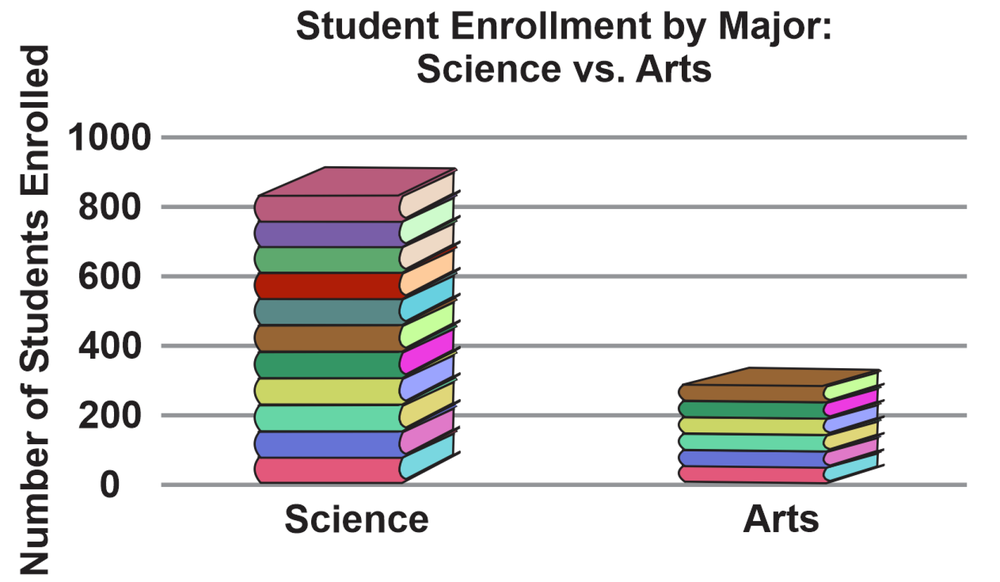
This graph is misleading because it uses images of stacked books to represent the number of students, which makes the difference in enrollment numbers appear larger than it actually is.
To accurately represent the data, use simple vertical bars instead of images. The height of each bar should correspond exactly to the enrollment numbers, and the width of the bars should be equal.