5. Binomial Distribution & Discrete Random Variables / Discrete Random Variables / Problem 4
Problem 4
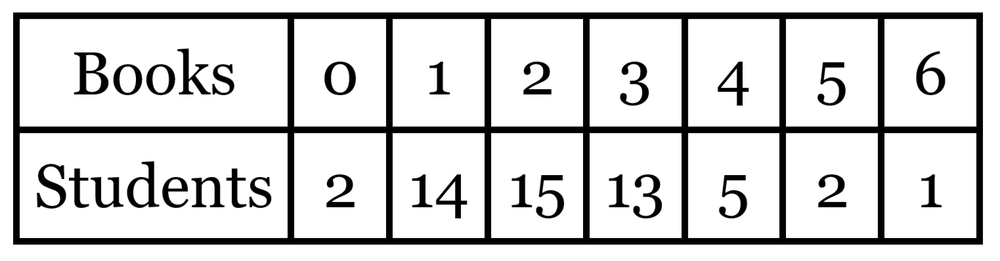
A survey was conducted to record the number of books read by students in a literature class during the last month. The data collected is as follows: Graph the histogram representing the probability distribution for the number of books read. Then, describe the shape of the distribution.