Frequency Distributions
- Download the worksheet to save time writing
- Start solving the practice problems
- If you're stuck, watch the video solutions
- See your summary to get more insights

Frequency Distributions
5 problems
Problem 1Multiple Choice
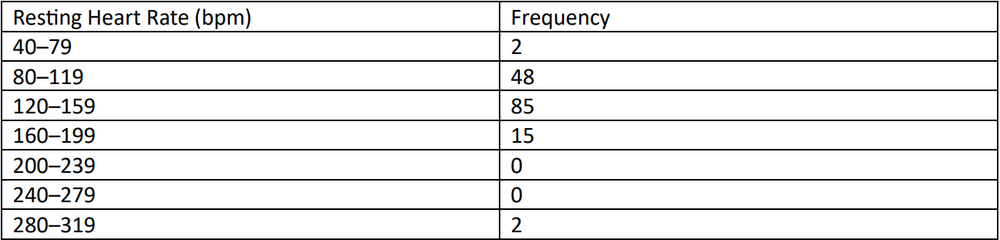
The table below summarizes the resting heart rate (in beats per minute) of a group of individuals. Identify the class width, class midpoints, and class boundaries for the given frequency distribution. Also, determine the total number of individuals included in the summary.
Problem 2Multiple Choice
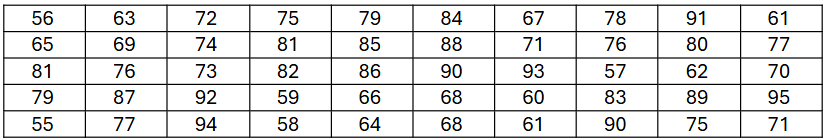
A university health center recorded the resting heart rates (beats per minute, BPM) of 50 students during a wellness checkup. Construct a frequency distribution using a class width of 5 BPM, starting with a lower class limit of 55 BPM. Does the frequency distribution suggest a normal distribution?
Problem 5Multiple Choice
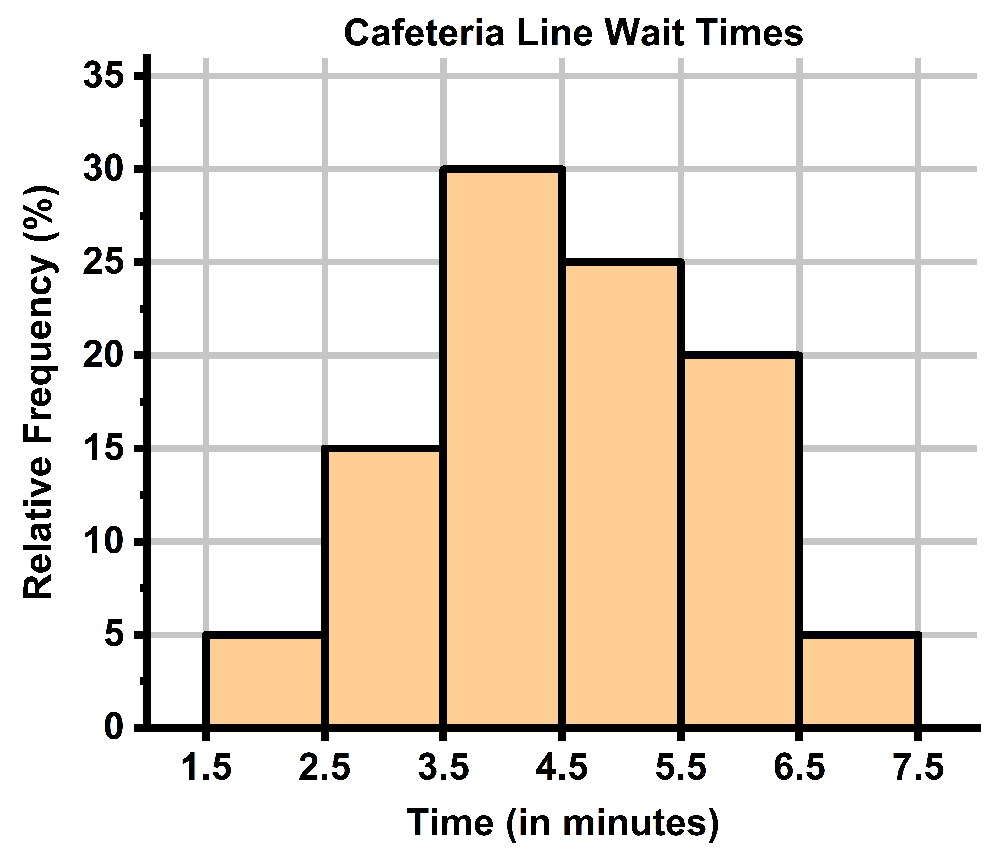
What is the most common cafeteria line wait time based on the relative frequency histogram?