2. Describing Data with Tables and Graphs / Frequency Distributions / Problem 2
Problem 2
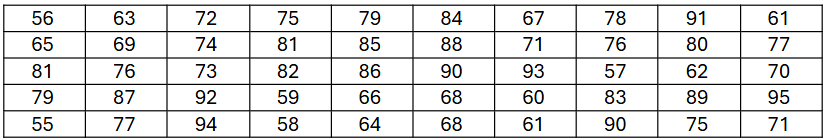
A university health center recorded the resting heart rates (beats per minute, BPM) of 50 students during a wellness checkup. Construct a frequency distribution using a class width of 5 BPM, starting with a lower class limit of 55 BPM. Does the frequency distribution suggest a normal distribution?