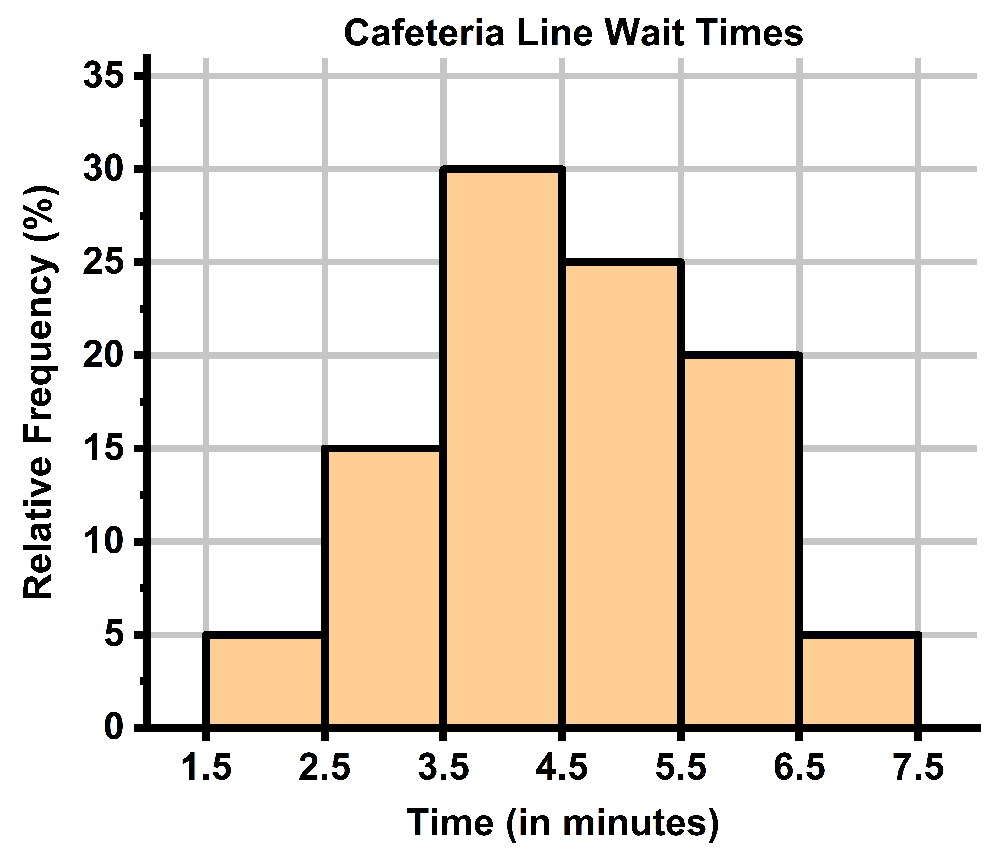
Frequency Distributions
2. Describing Data with Tables and Graphs / Frequency Distributions / Problem 5
Problem 5

What is the most common cafeteria line wait time based on the relative frequency histogram?
Relative frequency histogram showing cafeteria line wait times, with the highest frequency around 3.5 to 4.5 minutes.