Histograms
- Download the worksheet to save time writing
- Start solving the practice problems
- If you're stuck, watch the video solutions
- See your summary to get more insights

Histograms
5 problems
Problem 2Multiple Choice
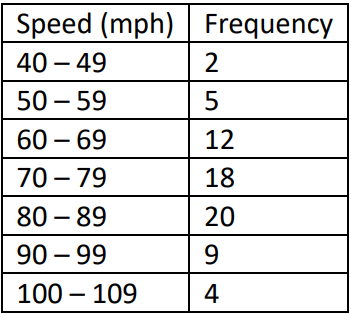
Vehicle Speeds on a Highway: Utilizing the following frequency distribution data, construct a histogram to answer the given question: Does the histogram appear to be skewed? If so, identify the type of skewness.
Problem 3Multiple Choice
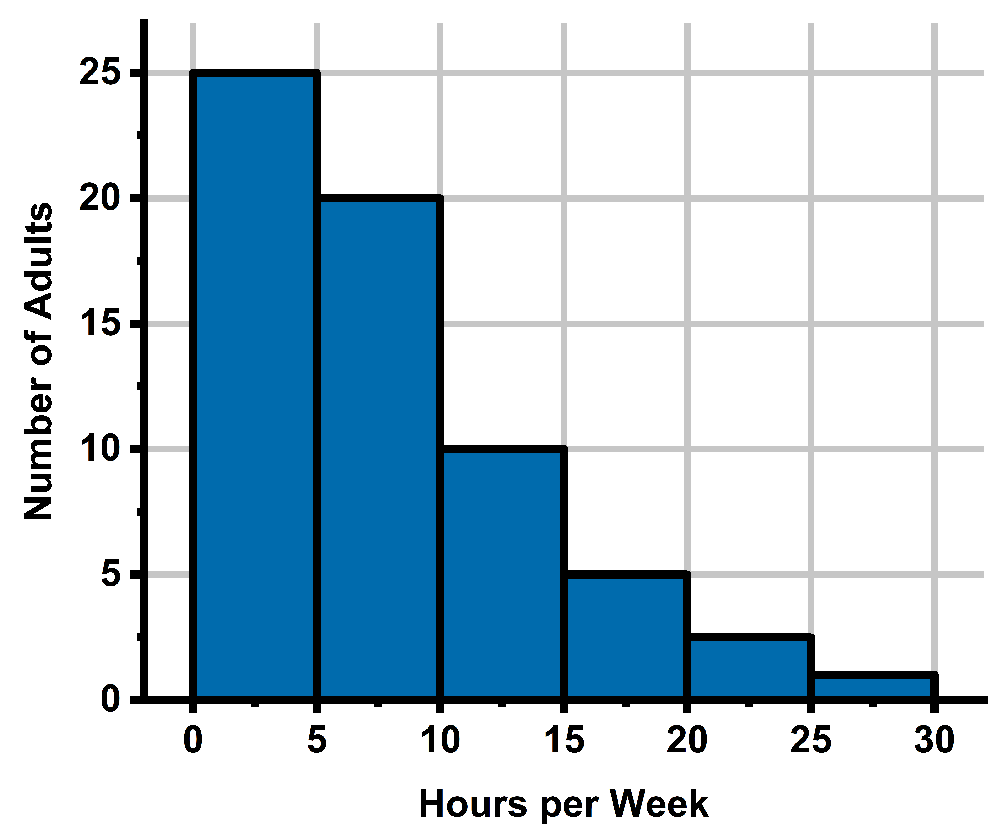
What is the approximate shape of the distribution in this histogram?
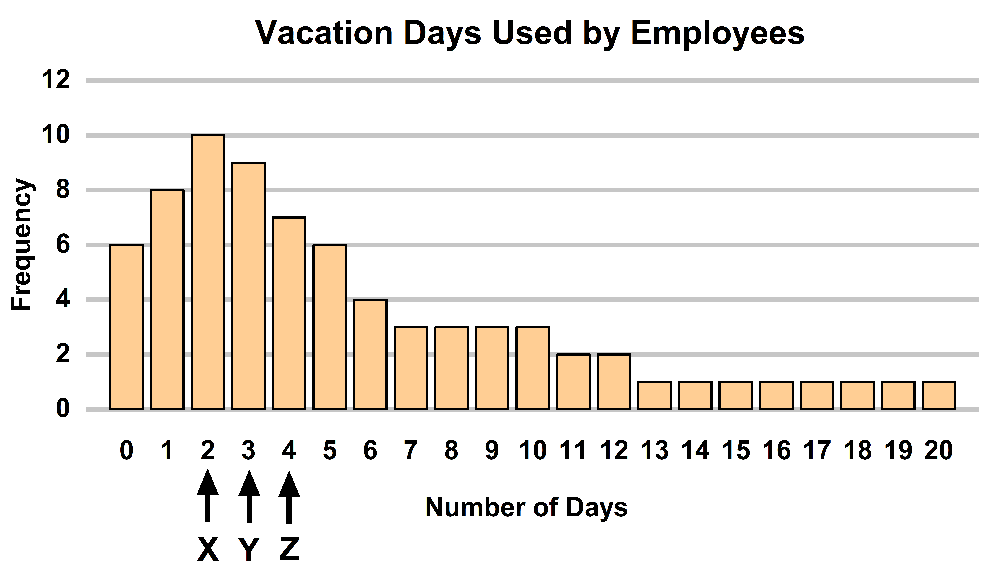
Problem 5Multiple Choice
The histogram below shows the number of vacation days used by employees in a company over the past year. The letters X, Y, and Z are marked at various points on the horizontal axis. Describe the shape of the data distribution and determine which letter (X, Y, or Z) corresponds to the mean, median, and mode.