Skip to main content
Statistics
My Course
Learn
Exam Prep
AI Tutor
Study Guides
Textbook Solutions
Flashcards
Explore
Try the app
My Course
Learn
Exam Prep
AI Tutor
Study Guides
Textbook Solutions
Flashcards
Explore
Try the app
Back
Histograms
Download worksheet
Problem 1
Problem 2
Problem 3
Problem 4
Problem 5
Histograms
Download worksheet
Practice
Summary
Previous
3 of 5
Next
2. Describing Data with Tables and Graphs / Histograms / Problem 3
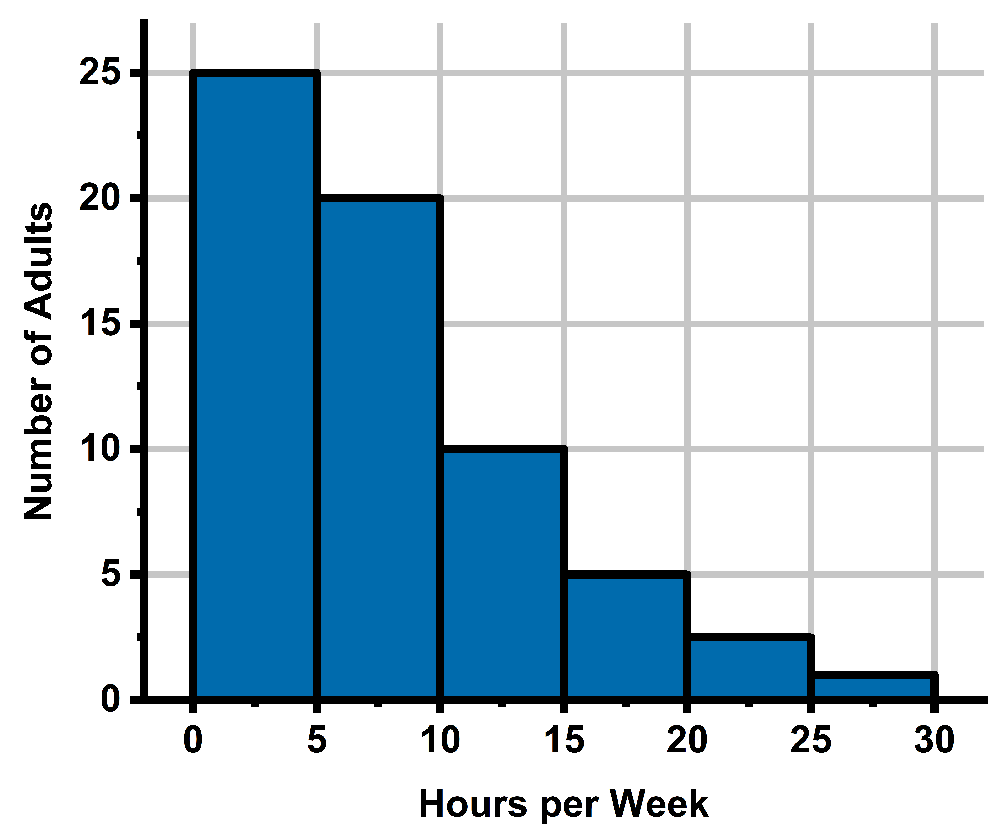
Problem 3
What is the approximate shape of the distribution in this histogram?
A
Right-skewed
B
Uniform
C
Symmetric
D
Left-skewed
AI tutor
0
0 Comments
Show Answer
More options