2. Describing Data with Tables and Graphs / Histograms / Problem 5
Problem 5
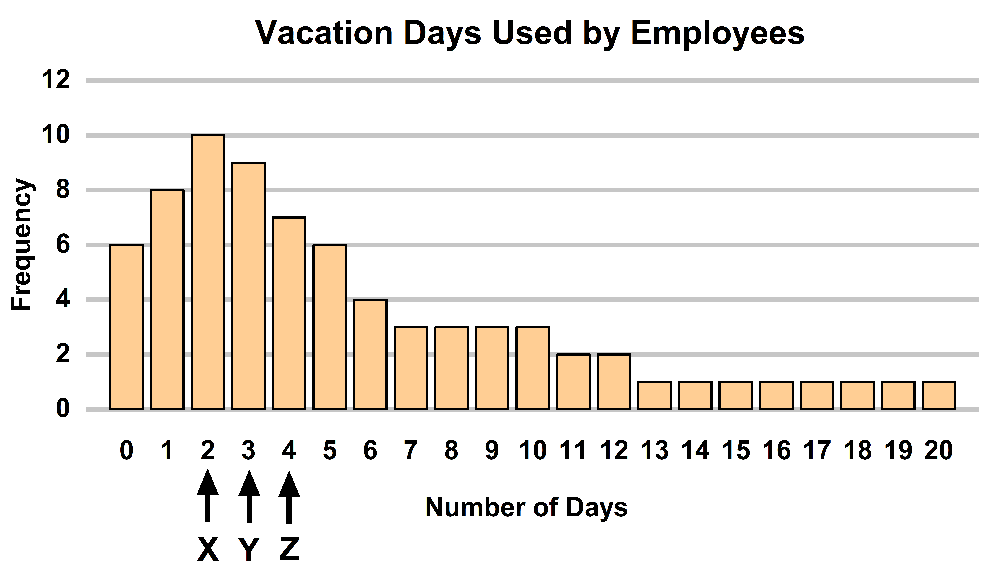
The histogram below shows the number of vacation days used by employees in a company over the past year. The letters X, Y, and Z are marked at various points on the horizontal axis. Describe the shape of the data distribution and determine which letter (X, Y, or Z) corresponds to the mean, median, and mode.