Statistics
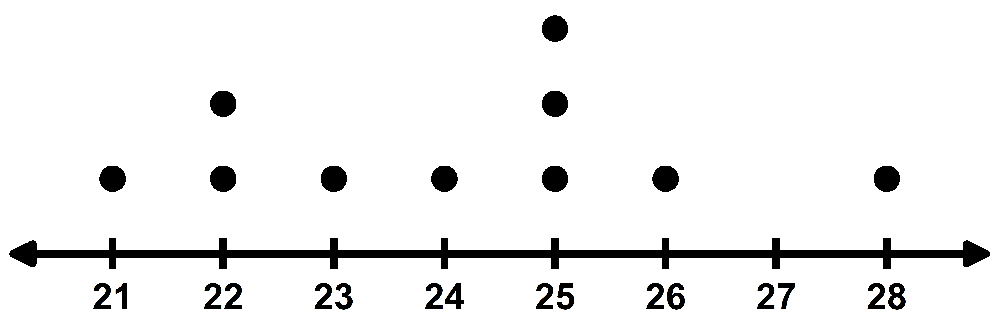
Mean: 24.124.1
Median: 24.024.0
Mode: 25.025.0
The mode best describes the center of the data
The median best describes the center of the data
Median: 24.524.5