
Calculate the -score that marks the cutoff for the top of the standard normal distribution.
Given the data for the systolic blood pressure of adult women with a mean of and a standard deviation of , assuming a normal distribution, find the probability that an adult woman has a systolic blood pressure less than .
Using a TI-84 graphing calculator, how would you calculate the probability that a z-score is less than -1.25?
A group of students took a chemistry quiz. The histogram for their scores is shown:
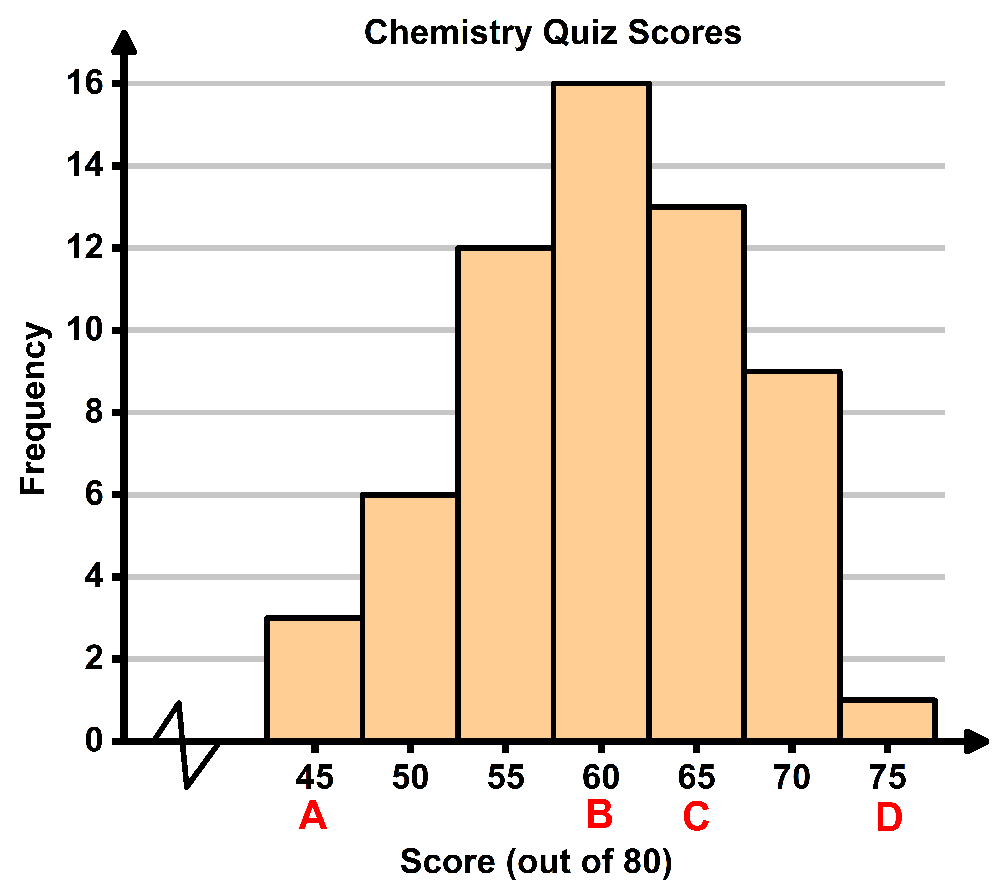
Four midpoints, , , , and , are marked on the histogram at scores of , , , and , respectively. Which of the four midpoints reasonably corresponds to a -score of ?
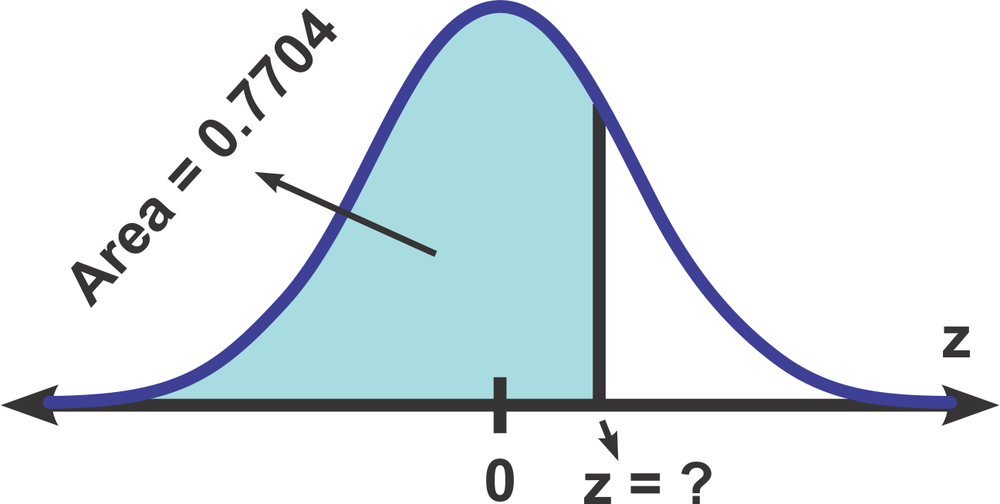
Scores on a standardized math test are normally distributed with a mean of and a standard deviation of . A randomly selected student scored on the test.
(a) What is the -score corresponding to the student’s score?
(b) Based on the -score, would this score be considered unusual?
Determine the indicated -score in the following graph:
A study finds that of university freshmen own a car. If you randomly select freshmen, what is the probability that fewer than of them own a car? Decide whether or not applying the normal approximation is suitable for this case, and if using it is possible. Is this event considered unusual?