Skip to main content
Statistics
My Course
Learn
Exam Prep
AI Tutor
Study Guides
Textbook Solutions
Flashcards
Explore
Try the app
My Course
Learn
Exam Prep
AI Tutor
Study Guides
Textbook Solutions
Flashcards
Explore
Try the app
Back
Boxplots-Excel definitions
You can tap to flip the card.
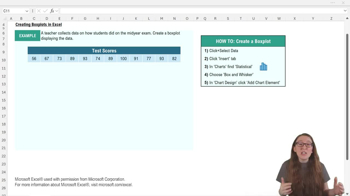
Box Plot
You can tap to flip the card.
👆
Box Plot
A chart displaying data distribution, showing median, quartiles, and outliers for visual analysis.
Track progress
Control buttons has been changed to "navigation" mode.
1/15
Related flashcards
Related practice
Recommended videos
Boxplots-Excel quiz
Boxplots-Excel
15 Terms
3. Describing Data Numerically
4 topics
11 problems
Chapter
David-Paige
03:30
Boxplots-Excel Example 1
414
views
14
rank
05:14
Boxplots-Excel
563
views
10
rank
Terms in this set (15)
Hide definitions
Box Plot
A chart displaying data distribution, showing median, quartiles, and outliers for visual analysis.
Median
The central value dividing a data set into two equal halves, often marked by a line in the box plot.
Quartile
A value splitting data into four equal parts, helping to identify spread and variability in a box plot.
Outlier
A data point significantly distant from others, highlighted in box plots to indicate unusual values.
Axis Scale
The numerical range shown on a chart's axis, adjustable to fit data and prevent visual distortion.
Data Label
A chart annotation displaying specific values, such as median or mean, to aid interpretation.
Chart Title
A descriptive heading for a chart, customizable to match the data context and improve clarity.
Whisker
A line extending from the box in a box plot, representing the range between quartiles and extreme values.
Continuous Data
Numerical information that can take any value within a range, suitable for box plot visualization.
Descriptive Statistics
Summary measures, such as median and quartiles, used to describe and interpret data sets.
Y-Axis
The vertical axis on a chart, often representing the variable's values and adjustable for better fit.
X-Axis
The horizontal axis on a chart, sometimes removed in box plots if it adds no useful information.
Data Distribution
The arrangement of values within a data set, visually represented in a box plot.
Mean
The average value of a data set, sometimes marked with an 'x' in Excel box plots.
Customization
Adjustments to chart elements, such as colors and bounds, to enhance readability and interpretation.
 BackBack
 03:30
03:30