- Download the worksheet to save time writing
- Start solving the practice problems
- If you're stuck, watch the video solutions
- See your summary to get more insights

A study recorded the time (in minutes) spent on daily exercise by a group of 50 individuals. The collected data was summarized into the following frequency distribution:
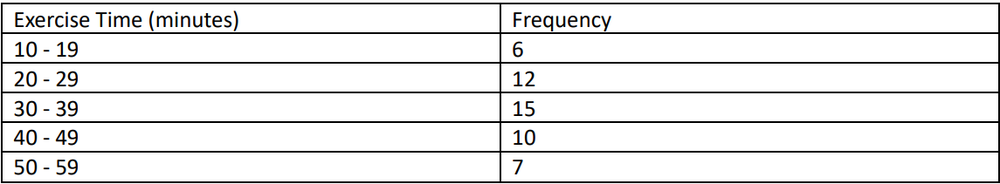
Compute the mean of the data summarized in the frequency distribution.
Compare the computed mean to the actual mean obtained from the original list of data values, which is 31.2 minutes.
A group of hobbyists recorded the number of minutes they spent gardening on a given day. The data collected is grouped into the following frequency distribution:
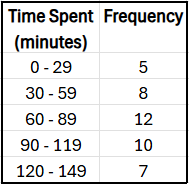
Approximate the mean number of minutes spent gardening.
Listed below are the number of books borrowed from a library by individuals.
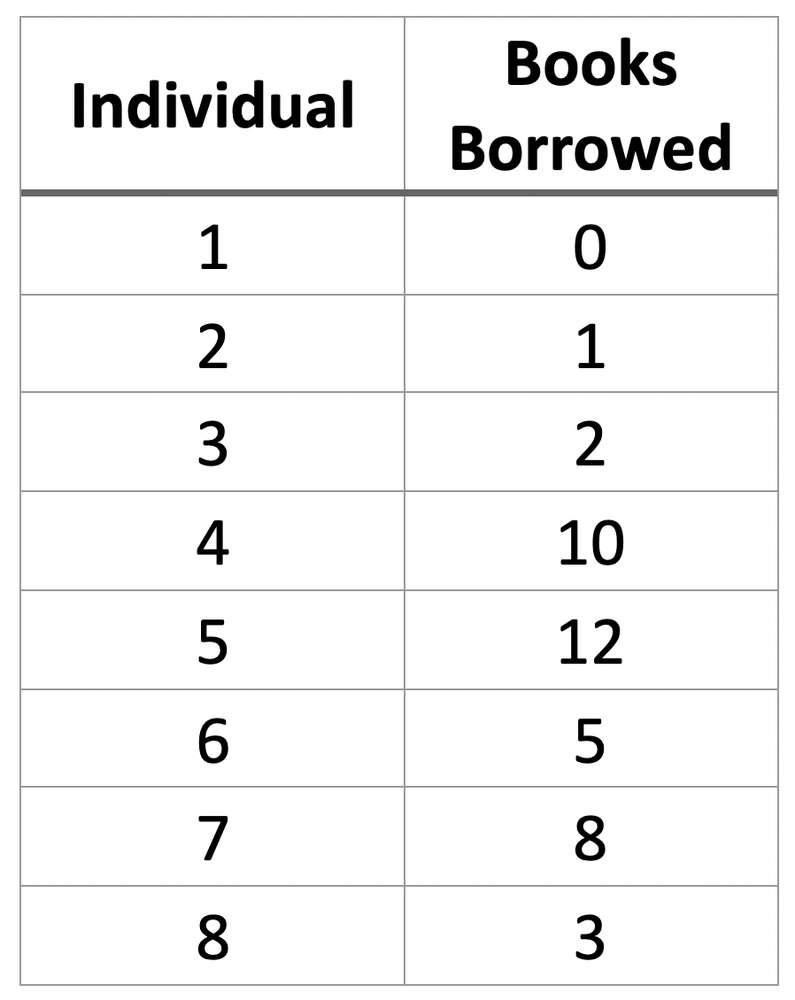
a. What is the mean of the number of books borrowed?
b. What is the median of the number of books borrowed?
A college surveyed students about the number of books they read for leisure in a semester. The results are grouped as follows:
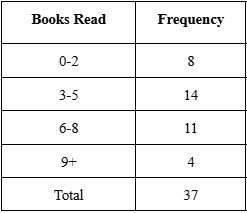
Estimate the sample mean and sample standard deviation. Use as the midpoint for the ' books' group.
Listed below are the self-reported weights (in kilograms) of adults and their corresponding measured weights, based on data from a national health survey.
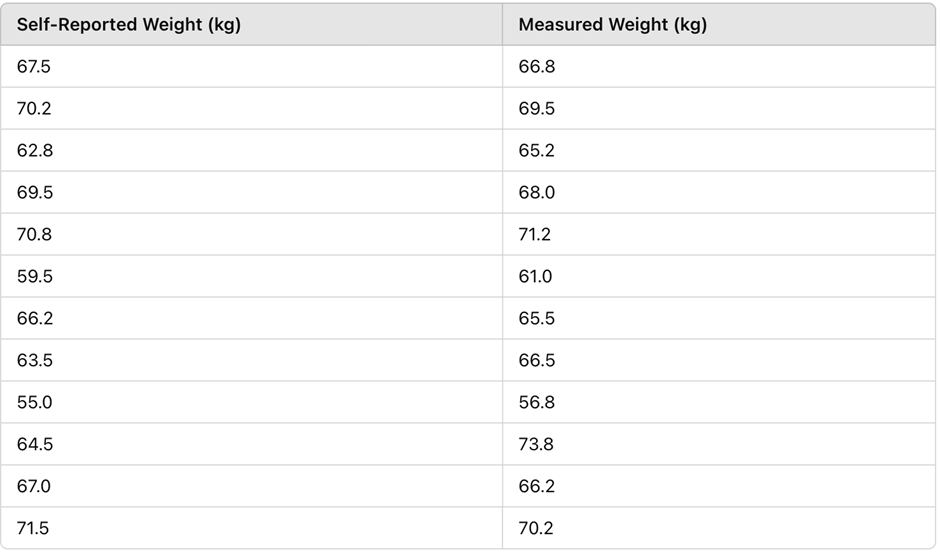

Compute the differences (self-reported weight – measured weight).
Use these differences to construct a boxplot and include the values of the 5-number summary.