Skip to main content
Statistics
My Course
Learn
Exam Prep
AI Tutor
Study Guides
Textbook Solutions
Flashcards
Explore
Try the app
My Course
Learn
Exam Prep
AI Tutor
Study Guides
Textbook Solutions
Flashcards
Explore
Try the app
Back
Critical Values and Rejection Regions definitions
You can tap to flip the card.
Hypothesis Test
You can tap to flip the card.
👆
Hypothesis Test
A procedure for evaluating claims about a population parameter using sample data and statistical evidence.
Track progress
Control buttons has been changed to "navigation" mode.
1/15
Related flashcards
Related practice
Recommended videos
Critical Values and Rejection Regions quiz
Critical Values and Rejection Regions
15 Terms
9. Hypothesis Testing for One Sample
1 topic
3 problems
Chapter
David-Paige
06:25
Critical Values and Rejection Regions
489
views
13
rank
03:32
Performing Hypothesis Test with Critical Values Example 1
225
views
7
rank
05:37
Performing Hypothesis Test with Critical Values
290
views
4
rank
Terms in this set (15)
Hide definitions
Hypothesis Test
A procedure for evaluating claims about a population parameter using sample data and statistical evidence.
Null Hypothesis
A statement asserting no effect or no difference, serving as the default assumption in statistical testing.
Alternative Hypothesis
A statement proposing a change or difference from the null, representing what researchers seek evidence for.
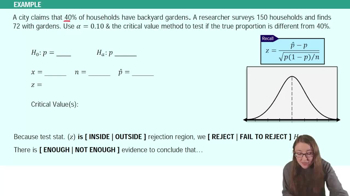
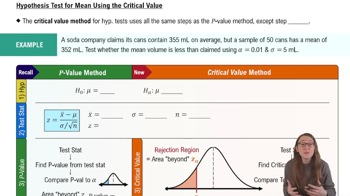
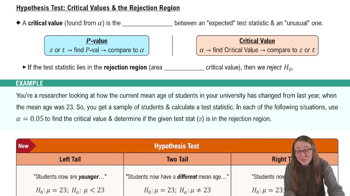
Critical Value
A threshold derived from the significance level, marking the boundary between typical and unusual test statistics.
Significance Level
A probability, denoted by alpha, indicating the risk of incorrectly rejecting the null hypothesis.
Rejection Region
An area in the distribution where test statistics are considered extreme enough to reject the null hypothesis.
Test Statistic
A calculated value, such as a z-score, summarizing sample data for comparison against critical values.
P Value
A probability measuring the strength of evidence against the null hypothesis, based on the test statistic.
Left-Tail Test
A hypothesis test where the rejection region is in the lower end of the distribution, indicating values less than expected.
Right-Tail Test
A hypothesis test with the rejection region in the upper end, focusing on values greater than expected.
Two-Tail Test
A hypothesis test with rejection regions in both extremes, assessing deviations in either direction from the expected value.
Z Table
A reference chart listing probabilities and critical values for the standard normal distribution.
Sample Size
The number of observations in a sample, influencing the reliability and validity of statistical conclusions.
Population Standard Deviation
A measure of variability in the entire population, used in calculating test statistics for hypothesis tests.
Normal Distribution
A symmetric, bell-shaped curve describing the spread of data, foundational for many statistical tests.
 BackBack
 06:25
06:25