Skip to main content
Statistics
My Course
Learn
Exam Prep
AI Tutor
Study Guides
Textbook Solutions
Flashcards
Explore
Try the app
My Course
Learn
Exam Prep
AI Tutor
Study Guides
Textbook Solutions
Flashcards
Explore
Try the app
Back
Performing Hypothesis Tests: Proportions definitions
You can tap to flip the card.
Population Proportion
You can tap to flip the card.
👆
Population Proportion
Represents the expected fraction of successes in the entire group being studied, often denoted by p.
Track progress
Control buttons has been changed to "navigation" mode.
1/15
Related flashcards
Related practice
Recommended videos
Performing Hypothesis Tests: Proportions quiz
Performing Hypothesis Tests: Proportions
15 Terms
9. Hypothesis Testing for One Sample
1 topic
3 problems
Chapter
David-Paige
05:52
Performing Hypothesis Tests: Proportions
957
views
13
rank
07:06
Performing Hypothesis Tests: Proportions Example 1
639
views
12
rank
03:32
Performing Hypothesis Tests: Proportions Using TI-84
291
views
4
rank
Terms in this set (15)
Hide definitions
Population Proportion
Represents the expected fraction of successes in the entire group being studied, often denoted by p.
Sample Proportion
Calculated by dividing the number of successes in a sample by the sample size; denoted as p hat.
Null Hypothesis
Assumes the population proportion equals a specified value, serving as the default claim in testing.
Alternative Hypothesis
Represents the claim being investigated, often suggesting the population proportion differs from the expected value.
Test Statistic
A value computed from sample data, used to assess the evidence against the null hypothesis; often a z-score.
Z-Score
Measures how far the sample proportion deviates from the expected proportion, standardized by sample size.
P-Value
Indicates the probability of observing a result as extreme as the sample, assuming the null hypothesis is true.
Significance Level
A threshold, denoted by alpha, used to decide whether to reject the null hypothesis; common values are 0.01 or 0.05.
Critical Value
A cutoff point on the test statistic scale that determines the rejection region for the null hypothesis.
Random Sample
A subset of the population selected so each member has an equal chance of inclusion, ensuring unbiased results.
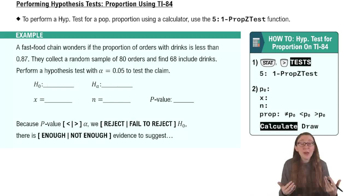
One-Proportion Z-Test
A statistical procedure used to compare a sample proportion to a hypothesized population proportion.
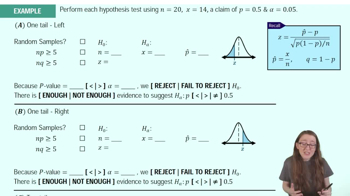
Left-Tailed Test
A hypothesis test where the alternative hypothesis suggests the population proportion is less than the expected value.
Alpha
Represents the probability of making a Type I error, or rejecting a true null hypothesis.
N
Denotes the sample size, or the total number of observations included in the analysis.
P Sub Zero
The hypothesized value for the population proportion entered into calculators for hypothesis testing.
 BackBack

 05:52
05:52