Skip to main content
Introductory Statistics
My Course
Learn
Exam Prep
AI Tutor
Study Guides
Textbook Solutions
Flashcards
Explore
Try the app
My Course
Learn
Exam Prep
AI Tutor
Study Guides
Textbook Solutions
Flashcards
Explore
Try the app
Back
Two Means - Unknown, Equal Variances Hypothesis Test - Excel quiz
You can tap to flip the card.
When should you use a pooled t test in hypothesis testing?
You can tap to flip the card.
👆
When should you use a pooled t test in hypothesis testing?
You use a pooled t test when comparing two population means and you can assume the populations have equal variances, even if you don't know the value.
Track progress
Control buttons has been changed to "navigation" mode.
1/15
Related flashcards
Related practice
Recommended videos
Two Means - Unknown, Equal Variances Hypothesis Test - Excel definitions
Two Means - Unknown, Equal Variances Hypothesis Test - Excel
14 Terms
Two Means - Known Variance
10. Hypothesis Testing for Two Samples
5 problems
Topic
Justin
10. Hypothesis Testing for Two Samples - Part 1 of 2
5 topics
12 problems
Chapter
Brendan
10. Hypothesis Testing for Two Samples - Part 2 of 2
1 topic
2 problems
Chapter
Ernest
Guided course
05:54
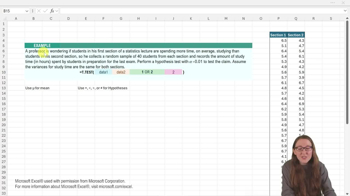
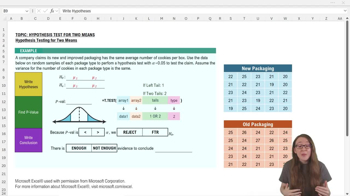
Two Means Unknown, Equal Variances Hypothesis Test - Excel
139
views
Guided course
04:00
Two Means Unknown, Equal Variances Hypothesis Test - Excel Example 1
130
views
Terms in this set (15)
Hide definitions
When should you use a pooled t test in hypothesis testing?
You use a pooled t test when comparing two population means and you can assume the populations have equal variances, even if you don't know the value.
What is the null hypothesis in a pooled t test for two means?
The null hypothesis states that the two population means are equal (mu1 = mu2).
What does the alternative hypothesis state in a two-tailed pooled t test?
The alternative hypothesis states that the two population means are not equal (mu1 ≠ mu2).
Which Excel function is used to perform a pooled t test?
The T.TEST function in Excel is used to perform a pooled t test.
What value should you enter for the 'type' argument in Excel’s T.TEST function to run a pooled t test?
You should enter 2 for the 'type' argument to specify a pooled t test in Excel.
How do you specify a two-tailed test in Excel’s T.TEST function?
You enter 2 for the 'tails' argument to indicate a two-tailed test.
What does the p-value represent in the context of a pooled t test?
The p-value represents the probability of observing the sample data, or something more extreme, if the null hypothesis is true.
What decision do you make if the p-value is less than the significance level (alpha)?
If the p-value is less than alpha, you reject the null hypothesis.
What conclusion can you draw if you reject the null hypothesis in a pooled t test?
You conclude that there is enough evidence to say the two population means are different.
What assumption about variances is required for the pooled t test?
The pooled t test assumes that the two populations have equal variances.
What is the significance level (alpha) commonly used in hypothesis testing?
A common significance level is 0.05, which means a 5% risk of rejecting the null hypothesis when it is actually true.
What are the first two inputs for the T.TEST function in Excel when comparing two means?
The first two inputs are the two datasets you want to compare.
How do you interpret a p-value of 0.003 when alpha is 0.05?
Since 0.003 is less than 0.05, you reject the null hypothesis and conclude the means are significantly different.
What does it mean if the p-value is greater than alpha in a pooled t test?
If the p-value is greater than alpha, you fail to reject the null hypothesis and conclude there is not enough evidence to say the means are different.
Why might you skip calculating the test statistic when using Excel’s T.TEST function?
Because the T.TEST function directly provides the p-value, so you can compare it to alpha without needing the test statistic.
 BackBack

 05:54
05:54