 Back
Chapter 1: Data Collection – Introductory Statistics Study Guide
Study Guide - Smart Notes
 Tailored notes based on your materials, expanded with key definitions, examples, and context.
Data Collection in Statistics
Introduction to the Practice of Statistics
Statistics is the science of collecting, organizing, summarizing, and analyzing information to draw conclusions or answer questions. It also involves providing a measure of confidence in any conclusions. The information used in statistics is called data, which describes characteristics of individuals and exhibits variability.
Statistics: The science of data analysis and interpretation.
Statistical Thinking: Understanding and accounting for variability in data.
Data: Facts or propositions used to draw conclusions or make decisions.
Variability: The tendency of data to differ among individuals or over time.
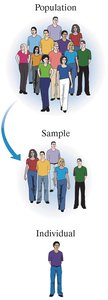
The Process of Statistics
The statistical process consists of four main steps:
Identify the research objective: Define the question(s) and population to be studied.
Collect the data: Gather information from a sample, as studying the entire population is often impractical.
Describe the data: Use descriptive statistics to summarize and organize data.
Perform inference: Apply inferential statistics to extend sample results to the population and report reliability.
Descriptive statistics involve numerical summaries, tables, and graphs. Inferential statistics use sample data to make generalizations about a population.
Population: The entire group of individuals to be studied.
Sample: A subset of the population.
Parameter: Numerical summary of a population.
Statistic: Numerical summary based on a sample.
Types of Variables
Qualitative vs. Quantitative Variables
Variables are characteristics of individuals in a population. They can be classified as:
Qualitative (Categorical) Variables: Classify individuals based on attributes or characteristics (e.g., gender, hair color).
Quantitative Variables: Provide numerical measures and can be meaningfully added or subtracted (e.g., height, age).
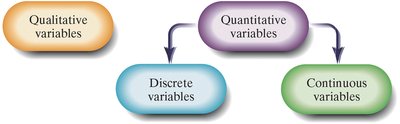
Discrete vs. Continuous Variables
Quantitative variables are further classified as:
Discrete Variables: Have a finite or countable number of possible values (e.g., number of students).
Continuous Variables: Have an infinite number of possible values within a range (e.g., weight, temperature).
Levels of Measurement
Variables can be measured at different levels:
Nominal: Values name, label, or categorize without a ranked order (e.g., types of phone).
Ordinal: Values can be ranked or ordered (e.g., education level).
Interval: Differences between values have meaning; zero does not indicate absence (e.g., temperature in Celsius).
Ratio: Ratios of values have meaning; zero indicates absence (e.g., income).
Sampling Methods
Simple Random Sampling
Simple random sampling ensures every possible sample of size n from a population of size N has an equal chance of being selected. Steps include:
List all individuals in the population.
Assign numbers to each individual.
Randomly select n numbers using a random number table or software.
Other Effective Sampling Methods
Several sampling methods are used to obtain representative samples:
Stratified Sampling: Divide the population into homogeneous groups (strata) and randomly sample from each stratum.
Systematic Sampling: Select every kth individual from the population after a random start.
Cluster Sampling: Divide the population into groups (clusters), randomly select some clusters, and sample all individuals within those clusters.
Convenience Sampling: Select individuals who are easily available; not recommended due to bias.
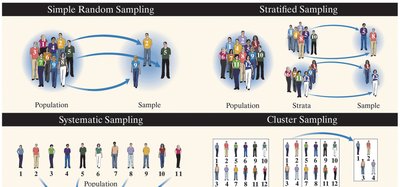
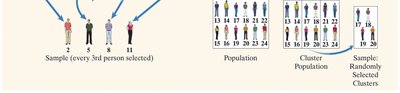
Bias in Sampling
Sources of Bias
If a sample is not representative of the population, it is biased. Main sources of bias include:
Sampling Bias: Technique favors one part of the population.
Nonresponse Bias: Individuals who do not respond differ from those who do.
Response Bias: Survey answers do not reflect true feelings due to interviewer error, misrepresented answers, question wording, or order.
Data-entry Error: Mistakes in recording data.
Nonsampling errors arise from bias or data-entry errors and can occur even in a census. Sampling error results from using a sample to estimate population information.
Design of Experiments
Characteristics of an Experiment
An experiment is a controlled study to determine the effect of varying explanatory variables (factors) on a response variable. Key concepts include:
Treatment: Combination of factor values applied to experimental units.
Experimental Unit: The subject or object receiving a treatment.
Control Group: Baseline group for comparison.
Placebo: An innocuous treatment used to mimic the experimental procedure.
Placebo Effect: Improvement due to belief in treatment rather than the treatment itself.
Blinding: Nondisclosure of treatment; can be single or double-blind.
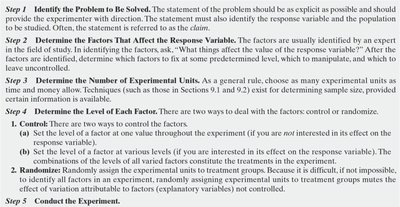
Steps in Designing an Experiment
Designing an experiment involves:
Identifying the problem to be solved.
Determining factors affecting the response variable.
Determining the number of experimental units.
Determining the level of each factor (control or randomize).
Conducting the experiment.
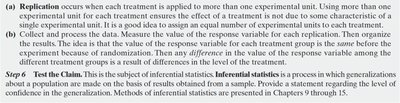
Replication: Applying each treatment to multiple units.
Collecting and processing data.
Testing the claim: Using inferential statistics to generalize results.
Experimental Designs
Completely Randomized Design: Experimental units are randomly assigned to treatments.
Matched-Pairs Design: Units are paired based on similarity; each pair receives different treatments.
Randomized Block Design: Units are grouped into blocks based on similarity, then randomly assigned to treatments within each block.
Random Sampling vs. Random Assignment
Random Sampling: Individuals are randomly selected from a population, allowing population-level inference.
Random Assignment: Available individuals are randomly assigned to treatment groups, allowing causal inference.
Summary Table: Sampling Methods
Method | Description | Example |
|---|---|---|
Simple Random | Every sample has equal chance | Randomly select 5 out of 435 members |
Stratified | Divide into strata, sample from each | Sample 4 Republicans, 4 Democrats, 1 Independent |
Systematic | Select every kth individual | Every 40th student from a list |
Cluster | Sample all individuals in selected groups | All students in 10 randomly selected classes |
Additional info: Academic context and examples have been expanded for clarity and completeness.
