 Back
BackChapter 1: Introduction to Statistics – Foundations, Data Types, and Sampling Methods
Study Guide - Smart Notes
 Tailored notes based on your materials, expanded with key definitions, examples, and context.
Intro to Statistics and Collecting Data
Statistical and Critical Thinking
Statistics is a foundational discipline used across many fields, including medicine, business, sports, engineering, and education. It involves the systematic process of planning studies, collecting data, and drawing meaningful conclusions.
Data: Collections of observations, such as measurements, survey responses, or categories.
Statistics: The science of planning studies and experiments, obtaining data, organizing, summarizing, presenting, analyzing, interpreting, and drawing conclusions.
Population: The complete set of individuals or items to be studied.
Sample: A subset of the population, selected for analysis.
Census: Data collection from every member of a population.
Example: In a survey of 232 college freshmen, 22% got lost on their way to class during the first week. Here, the population is all college freshmen, and the sample is the 232 surveyed students.
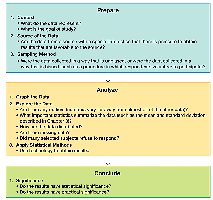
Statistical Study Design
Proper study design is essential for obtaining unbiased and representative results. Biased samples can lead to misleading conclusions and poor decision-making.
Unbiased Statistic: A statistic that accurately represents the population.
Biased Sample: A sample that favors one outcome over another, often due to poor sampling methods.
Statistical Significance vs. Practical Significance
Statistical significance refers to the likelihood that an observed effect is due to chance (commonly set at 5% or less). Practical significance considers whether the effect is large enough to be meaningful in real-world decision-making.
Statistical Significance: Achieved if the probability of an event occurring by chance is 5% or less.
Practical Significance: Considers whether the observed effect is large enough to be useful or meaningful in practice.
Example: Getting 98 girls in 100 random births is statistically significant; getting 52 girls is not.
Problems When Analyzing Data
Several issues can arise during data analysis, potentially leading to incorrect conclusions.
Misleading Conclusions: Correlation does not imply causation.
Reported Results: Self-reported data may be inaccurate.
Small Samples: May not represent the population.
Loaded Questions: Wording can influence responses.
Order of Questions: Can affect survey results.
Non-responses, Missing Data, Inaccurate Numbers, Incorrect Percentages: All can bias results.
Describing Data: Types and Levels of Measurement
Types of Data
Data can be classified as either quantitative (numerical) or categorical (qualitative).
Parameter: A numerical measurement describing a characteristic of a population.
Statistic: A numerical measurement describing a characteristic of a sample.
Quantitative Data: Numbers representing counts or measurements (e.g., weights, ages).
Categorical Data: Names or labels representing categories (e.g., gender, shirt numbers).
Example: The average age of all students at a college is a parameter; the average age from a sample is a statistic.
Types of Quantitative Data
Discrete Data: Finite or countable values (e.g., number of eggs laid by a hen).
Continuous Data: Infinitely many possible values on a continuous scale (e.g., height, weight, milk produced).
Levels of Measurement
Data can be measured at four levels, each with increasing complexity and mathematical meaning.
Nominal: Categories only; no order (e.g., gender, eye color).
Ordinal: Categories with order; differences are not meaningful (e.g., letter grades, rankings).
Interval: Ordered, meaningful differences; no true zero (e.g., temperature, years).
Ratio: Ordered, meaningful differences and ratios; true zero exists (e.g., height, age, weight).
Summary Table:
Level | Description | Examples |
|---|---|---|
Nominal | Categories only | Gender, Eye Color |
Ordinal | Categories with order | Letter Grades, Rankings |
Interval | Differences, no true zero | Temperature, Years |
Ratio | Differences and true zero | Height, Weight, Age |
Collecting Sample Data
Observational Studies vs. Experiments
Data can be collected through observational studies or experiments, each with distinct methodologies.
Observational Study: Observing and measuring characteristics without modifying subjects.
Experiment: Applying a treatment and observing its effects; subjects are called experimental units.
Example: Giving aspirin to some subjects and a placebo to others is an experiment; surveying adults about credit cards is observational.
Sampling Methods
Sampling methods are crucial for obtaining representative data. Several techniques are commonly used:
Simple Random Sample: Every possible sample of size n has an equal chance of being chosen.
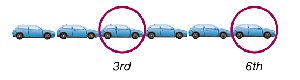
Systematic Sample: Selecting every nth item from the population.
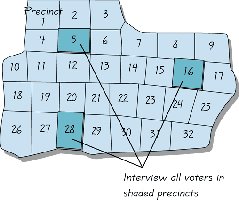
Cluster Sample: Dividing the population into clusters, randomly selecting clusters, and including all members from those clusters.

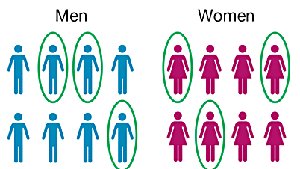
Stratified Sample: Subdividing the population into strata based on shared characteristics, then sampling from each stratum.
Convenience Sample: Using samples that are easily obtained and readily available; often leads to bias.
Voluntary Response Sample: Respondents decide whether to participate; often biased.
Example: Identifying Sampling Methods
Maps and diagrams can help illustrate different sampling methods, such as cluster sampling where all members in selected precincts are interviewed.
Types of Observational Studies
Observational studies can be classified based on the timing of data collection:
Cross-sectional Study: Data collected at one point in time.
Retrospective (Case-Control) Study: Data collected from the past.
Prospective (Cohort) Study: Data collected in the future from groups sharing common factors.
Example: Interviewing Olympic gold medalists from 1992 to 2008 is a retrospective study.
