 Back
BackChapter 8: Hypothesis Testing in Statistics – Concepts, Methods, and Applications
Study Guide - Smart Notes
 Tailored notes based on your materials, expanded with key definitions, examples, and context.
Section 8: Basics of Hypothesis Testing
Introduction to Hypothesis Testing
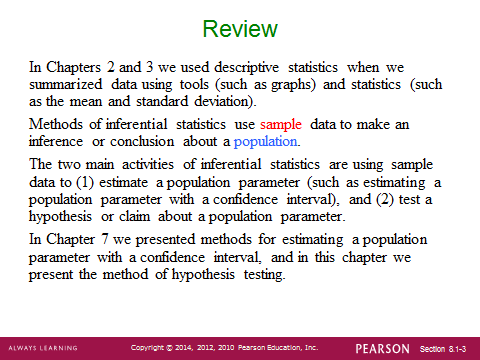
Hypothesis testing is a fundamental method in inferential statistics, allowing us to use sample data to make inferences or draw conclusions about a population parameter. This process is essential for evaluating claims or assumptions about population characteristics based on sample evidence.
Parameter Types: The parameters commonly tested are the population mean (μ) and population proportion (p).
Purpose: To determine whether there is enough statistical evidence in a sample to infer that a certain condition holds for the entire population.
Examples of Hypotheses That Can Be Tested
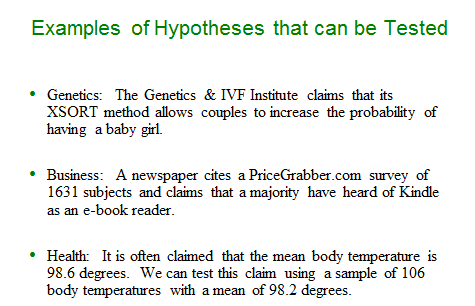
Hypothesis testing is widely applicable across various fields, including genetics, business, and health sciences. Here are some illustrative examples:
Genetics: Testing if a medical method increases the probability of a specific outcome (e.g., having a baby girl).
Business: Determining if a majority of survey respondents prefer a particular product.
Health: Assessing if the mean body temperature of a population differs from a commonly accepted value.
Steps in Hypothesis Testing
General Procedure
The process of hypothesis testing involves several structured steps to ensure objectivity and clarity:
Identify the claim and express it in symbolic form.
State the opposite of the claim in symbolic form.
Formulate hypotheses: The null hypothesis (H0) always contains equality (=), while the alternative hypothesis (H1) contains the inequality (<, >, or ≠). Indicate which hypothesis represents the claim.
Choose the significance level (α): This is the probability threshold for rejecting H0. Common values are 0.05, 0.01, or 0.10.
Identify the parameter being tested: Is it a proportion (p) or a mean (μ)?
Select the appropriate test: Use the P-value method or the Critical Value method.
Make a decision: Based on the comparison of the test statistic or P-value with the critical value or α.
State the conclusion: Clearly interpret the results in the context of the original claim.
Methods of Hypothesis Testing
P-value Method: Calculate the P-value and compare it to α. If P-value < α, reject H0.
Critical Value Method: Calculate the test statistic (z or t), find the critical value, and determine if the test statistic falls in the rejection region.
Conclusion Statements
The conclusion depends on the nature of the original claim and the outcome of the test. The following table summarizes the possible conclusions:
Condition | Conclusion |
|---|---|
Original claim does not include equality, and you reject H0 | There is sufficient evidence to support the claim that ... |
Original claim does not include equality, and you fail to reject H0 | There is not sufficient evidence to support the claim that ... |
Original claim includes equality, and you reject H0 | There is sufficient evidence to warrant rejection of the claim that ... |
Original claim includes equality, and you fail to reject H0 | There is not sufficient evidence to warrant rejection of the claim that ... |
Calculator Shortcuts for Hypothesis Tests
Proportion (p): STAT/TEST → 5:1-PropZTest
Mean (μ) without σ: STAT/TEST → 2:T-Test
Mean (μ) with σ: STAT/TEST → 1:Z-Test
Types of Hypothesis Tests
One-Tailed and Two-Tailed Tests
The direction of the alternative hypothesis determines the type of test:
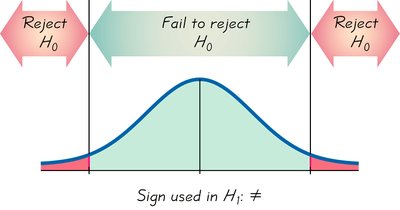
Two-tailed test: H1: parameter ≠ value
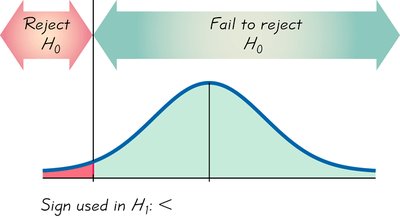
Left-tailed test: H1: parameter < value
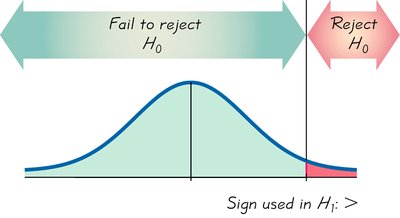
Right-tailed test: H1: parameter > value
Each test type has a different rejection region on the probability distribution curve.
Finding Critical Values
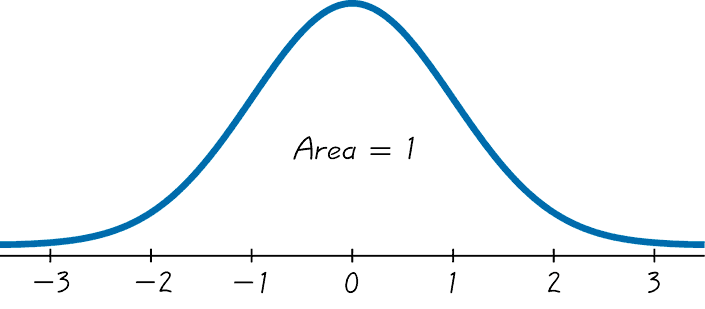
Critical values are determined based on the type of test and the chosen significance level (α). For normal distributions, use the inverse normal function; for t-distributions, use the inverse t function with appropriate degrees of freedom (df = n - 1).
Two-tailed: InvNorm(area, 0, 1) or InvT(area, df)
Left-tailed: InvNorm(area, 0, 1) or InvT(area, df)
Right-tailed: InvNorm(area, 0, 1) or InvT(area, df)


Practice Problems: Applying Hypothesis Testing
General Steps for Each Problem
Identify the given variables (sample size, sample mean/proportion, population parameter, standard deviation, significance level).
Express the claim and its opposite in symbolic form.
Assign H0 and H1 appropriately.
Determine the test type (left, right, or two-tailed).
Identify the parameter and select the correct test/calculator function.
Apply the P-value and/or Critical Value method.
Decide to reject or fail to reject H0.
State the conclusion in plain language, addressing the original claim.
Sample Problem Types
Proportion Test Example: Testing if the majority of adults prefer window seats on flights.
Mean Test Example: Testing if the mean body temperature differs from 98.6°F.
Right-Tailed Test Example: Testing if the mean weight of discarded plastic is greater than a specified value.
Key Formulas
Test Statistic for Proportion (z-test)
Used when testing claims about a population proportion:
\( \hat{p} \): sample proportion
\( p_0 \): claimed population proportion
\( n \): sample size
Test Statistic for Mean (z-test, known σ)
Used when the population standard deviation is known:
\( \bar{x} \): sample mean
\( \mu_0 \): claimed population mean
\( \sigma \): population standard deviation
\( n \): sample size
Test Statistic for Mean (t-test, unknown σ)
Used when the population standard deviation is unknown:
\( s \): sample standard deviation
Summary Table: Hypothesis Test Types and Calculator Functions
Parameter | Known/Unknown σ | Calculator Function |
|---|---|---|
Proportion (p) | -- | 1-PropZTest |
Mean (μ) | Known σ | Z-Test |
Mean (μ) | Unknown σ | T-Test |
Additional info: The notes and images provided cover the essential concepts, procedures, and visualizations for hypothesis testing, including the logic of rejection regions, the use of significance levels, and the application of both z and t tests for means and proportions. The practice problems reinforce the step-by-step approach to hypothesis testing in real-world contexts.
