 Back
BackComprehensive Study Notes for Introductory Statistics
Study Guide - Smart Notes
 Tailored notes based on your materials, expanded with key definitions, examples, and context.
Introduction to Statistics
Overview of the Statistical Process
Statistics is the science of collecting, organizing, analyzing, and interpreting data to make decisions. The process involves several key steps, from gathering data to making inferences about populations based on samples.
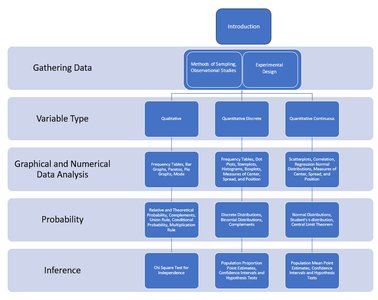
Gathering Data
Populations, Samples, and Sampling Methods
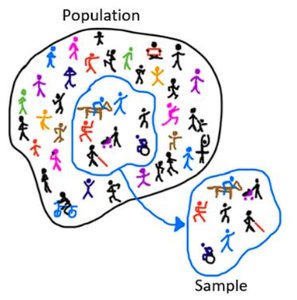
Understanding the difference between a population and a sample is fundamental in statistics. The population is the entire group of individuals or items of interest, while a sample is a subset of the population selected for analysis. Sampling methods are crucial for obtaining representative data.
Population (N): The complete set of all possible observations.
Sample (n): A subset of the population, used to make inferences about the population.
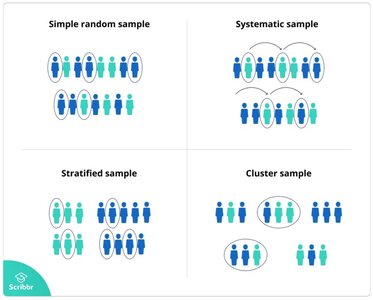
Sampling Methods:
Simple Random Sample (SRS): Every member has an equal chance of being selected.
Systematic Sample: Every kth member is selected after a random start.
Stratified Sample: Population divided into strata, then random samples taken from each stratum.
Cluster Sample: Population divided into clusters, some clusters are randomly selected, and all members in those clusters are sampled.
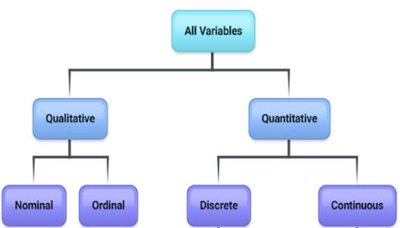
Variable Types
Classification of Variables
Variables are characteristics or properties that can take on different values. They are classified as either qualitative (categorical) or quantitative (numerical). Quantitative variables can be further divided into discrete and continuous types.
Qualitative (Categorical): Describes qualities or categories (e.g., gender, color).
Quantitative: Describes numerical values.
Discrete: Countable values (e.g., number of students).
Continuous: Measurable values within a range (e.g., height, weight).
Graphical and Numerical Data Analysis
Qualitative Data: Tables and Graphs
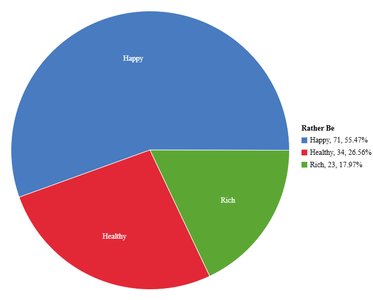
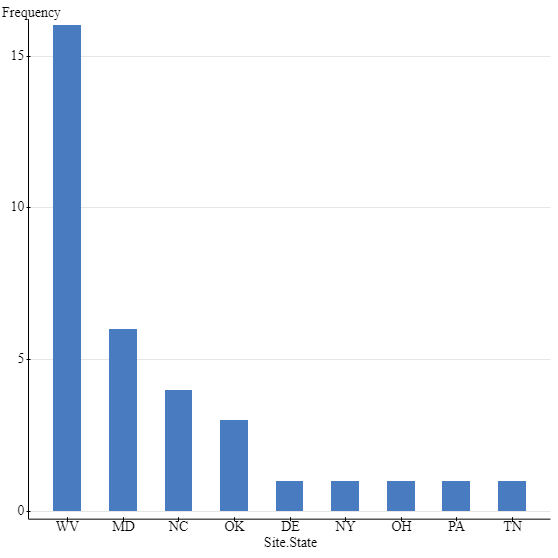
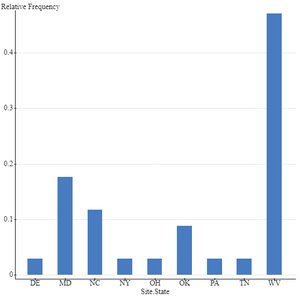
Qualitative data is summarized using frequency tables and visualized with bar graphs, Pareto charts, and pie charts.
Frequency Table: Shows counts for each category.
Relative Frequency Table: Shows proportions or percentages for each category.
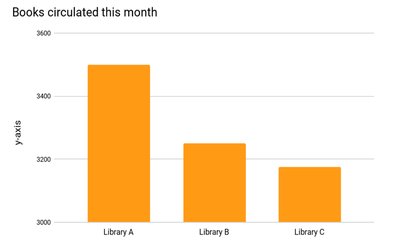
Bar Graph: Uses bars to represent frequencies of categories.
Pareto Chart: Bar graph with bars in descending order.
Pie Chart: Shows proportions as slices of a circle.
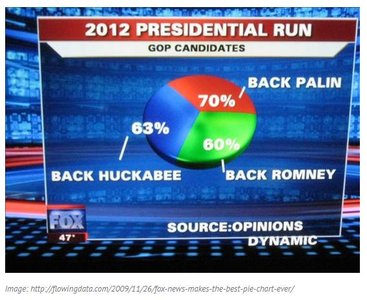
Misleading Graphs
Graphs can be misleading if axes are manipulated or if visual elements distort the data. Always check for proper scaling and representation.
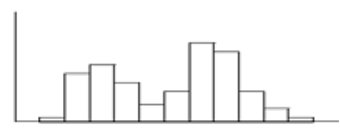
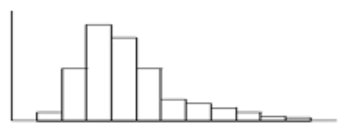
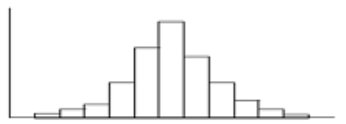
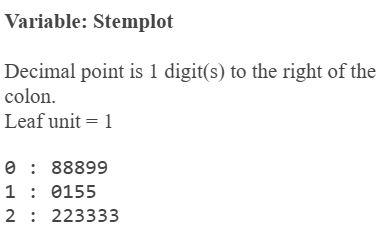
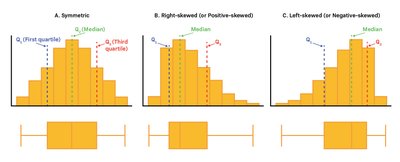
Quantitative Data: Histograms and Distribution Shapes
Quantitative data is often summarized with histograms, which show the distribution of data across intervals (bins). The shape of the distribution provides insight into the data's characteristics.
Symmetric: Data is evenly distributed around the center.
Positively Skewed (Right): Tail extends to the right.
Negatively Skewed (Left): Tail extends to the left.
Bimodal: Two peaks in the distribution.
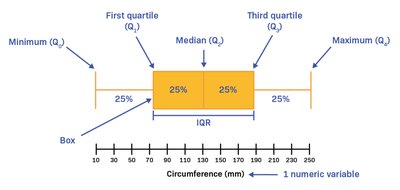
Measures of Center and Spread
Key numerical summaries include:
Mean (\( \mu \) or \( \bar{x} \)): Arithmetic average.
Median: Middle value when data is ordered.
Mode: Most frequent value.
Range: Difference between maximum and minimum values.
Interquartile Range (IQR): Difference between the third and first quartiles (middle 50%).
Probability
Basic Probability Concepts
Probability quantifies the likelihood of events. The sample space is the set of all possible outcomes. An event is a subset of the sample space.
Classical Probability: Based on equally likely outcomes.
Empirical Probability: Based on observed data.
Law of Large Numbers: As the number of trials increases, empirical probability approaches theoretical probability.
Complementary Events: The probability that event A does not occur is 1 - P(A).
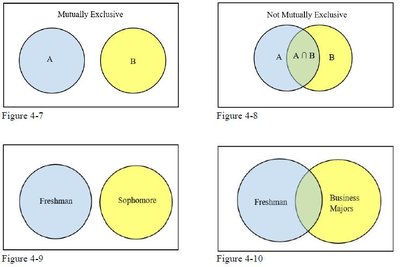
Contingency Tables and Venn Diagrams
Contingency tables summarize the relationship between two categorical variables. Venn diagrams visually represent relationships between events, such as mutual exclusivity and intersections.
Marginal Probability: Probability of a single event.
Joint Probability: Probability of two events occurring together.
Conditional Probability: Probability of one event given another has occurred.
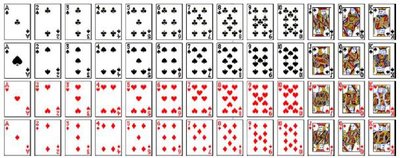
Probability with Cards
Standard decks are often used to illustrate probability concepts, such as the probability of drawing a face card or a spade.
Inference
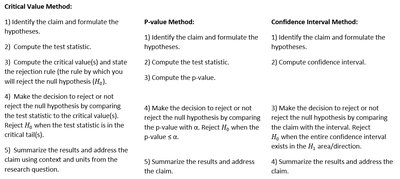
Statistical Inference: Hypothesis Testing and Confidence Intervals
Statistical inference involves making conclusions about populations based on sample data. Two main tools are hypothesis testing and confidence intervals.
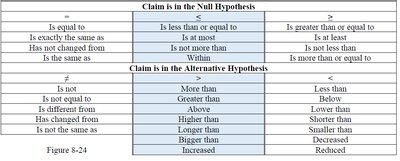
Hypothesis Test: Procedure to test claims about population parameters.
Null Hypothesis (H0): Statement of no effect or status quo.
Alternative Hypothesis (Ha): Statement of a difference or effect.
P-value: Probability of observing data as extreme as the sample, assuming H0 is true.
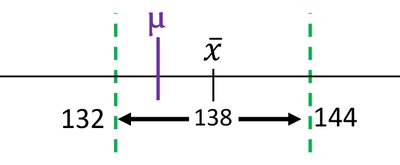
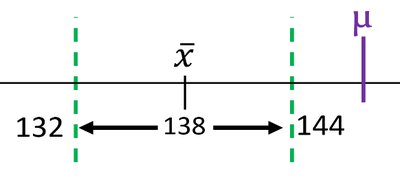
Confidence Interval: Range of values likely to contain the population parameter.
Types of Errors
Type I Error (α): Rejecting a true null hypothesis.
Type II Error (β): Failing to reject a false null hypothesis.
Additional info:
These notes cover the foundational topics in an introductory statistics course, including data collection, types of variables, graphical and numerical summaries, probability, and statistical inference.
For more advanced topics such as regression, ANOVA, and chi-square tests, refer to subsequent chapters or sections in your course materials.
