Back

Comprehensive Study Notes for Introductory Statistics

Study Guide - Learn with Videos

Curated lessons matched to your uploaded material – learn every topic step by step.

Intro to Stats

  • Guided course
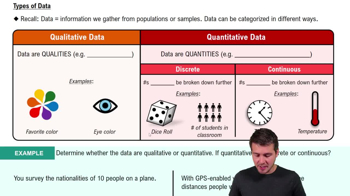
    Types of Data
    04:24
  • Guided course
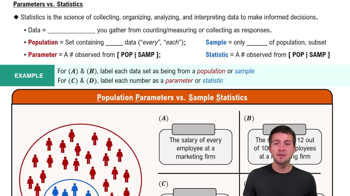
    Parameters vs. Statistics
    05:53
  • Guided course
    Introduction to Statistics Channel
    2:13

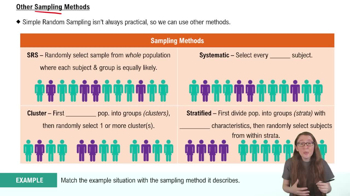
Sampling Methods

  • Guided course
    Sampling Methods Example 2
    03:07
  • Guided course
    Simple Random Sampling Example 1
    01:30
  • Guided course
    Sampling Methods
    05:27

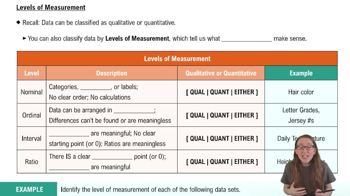
Levels of Measurement

  • Guided course
    Levels of Measurement
    06:52
  • Guided course
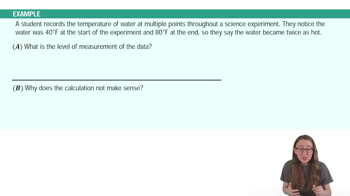
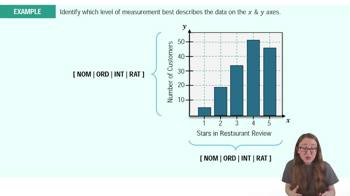
    Levels of Measurement Example 1
    02:46
  • Guided course
    Levels of Measurement Example 2
    02:46

Frequency Distributions

  • Guided course
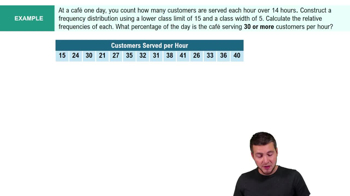
    Intro to Frequency Distributions Example 1
    06:19
  • Guided course
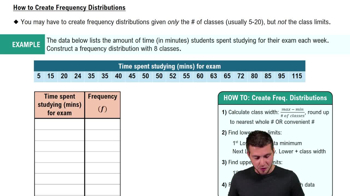
    How to Create Frequency Distributions
    06:29
  • Guided course
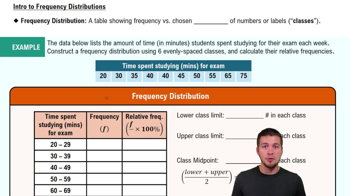
    Intro to Frequency Distributions
    06:38

Bar Graphs and Pareto Charts

  • Guided course
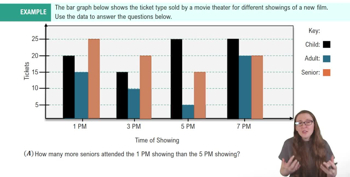
    Bar Graphs and Pareto Charts Example 1
    05:26
  • Guided course
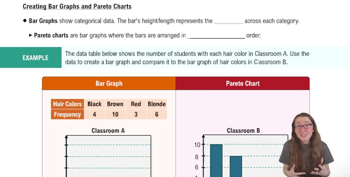
    Creating Bar Graphs and Pareto Charts
    04:52

Pie Charts

  • Guided course
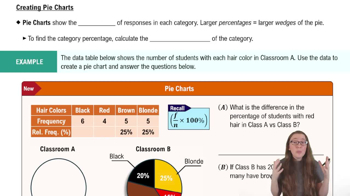
    Creating Pie Charts
    06:10
  • Guided course
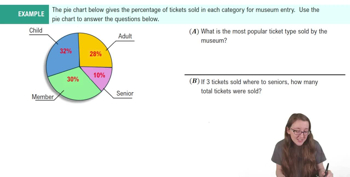
    Pie Charts Example 1
    01:18

Basic Concepts of Probability

  • Guided course
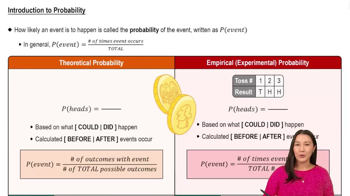
    Introduction to Probability
    5:37

Introduction to Contingency Tables

  • Guided course
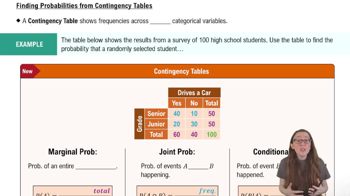
    Introduction to Contingency Tables
    05:35
  • Guided course
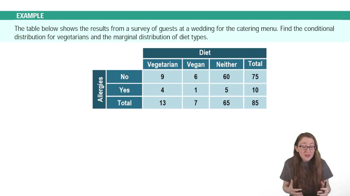
    Introduction to Contingency Tables Example 2
    03:05
  • Guided course
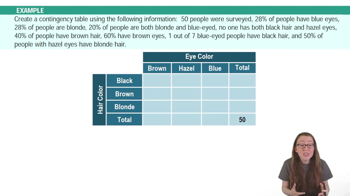
    Introduction to Contingency Tables Example 1
    04:15

Independence Tests

  • Guided course
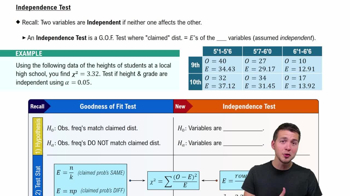
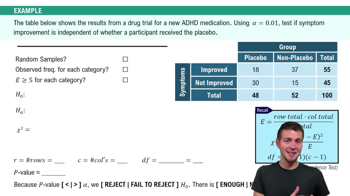
    Independence Test
    06:28
  • Guided course
    Independence Test Example 1
    08:07

Frequency Distributions

  • Guided course
    Intro to Frequency Distributions Example 1
    06:19
  • Guided course
    How to Create Frequency Distributions
    06:29
  • Guided course
    Intro to Frequency Distributions
    06:38

Dot Plots

  • Guided course
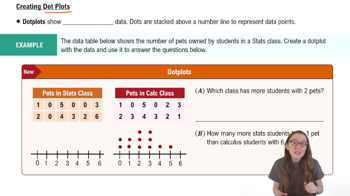
    Creating Dotplots
    04:01

Mean

  • Guided course
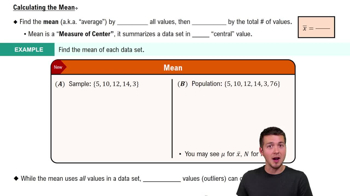
    Calculating the Mean
    04:52
  • Guided course
     Calculating the Mean Example 1
    03:08

Median

  • Guided course
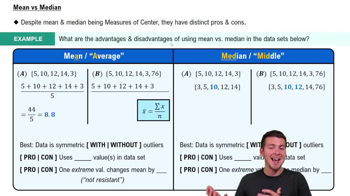
    Comparing Mean vs. Median
    04:48
  • Guided course
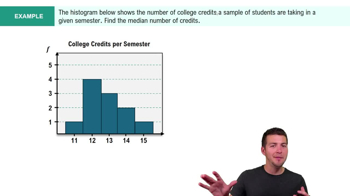
    Calculating the Median Example 1
    02:35
  • Guided course
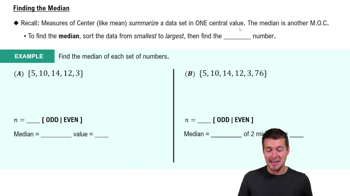
    Calculating the Median
    03:26

Mode

  • Guided course
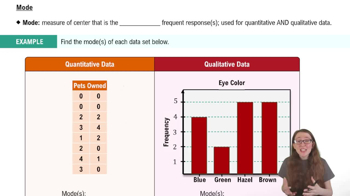
    Mode
    03:20

Boxplots

  • Guided course
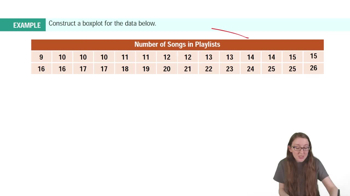
    Boxplots Example 1
    01:52
  • Guided course
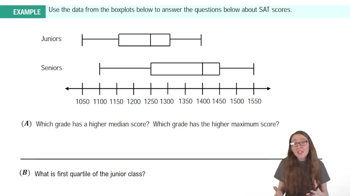
    Boxplots Example 2
    02:48
  • Guided course
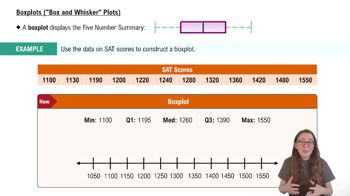
    Boxplots ("Box and Whisker Plots")
    03:54

Discrete Random Variables

  • Guided course
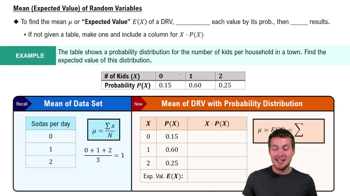
    Expected Value (Mean) of Random Variables
    04:14
  • Guided course
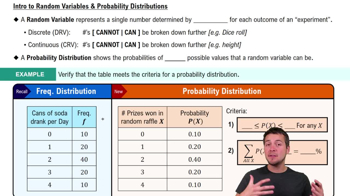
    Intro to Random Variables & Probability Distributions
    07:09
  • Guided course
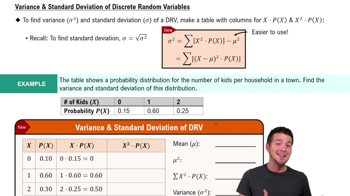
    Variance & Standard Deviation of Discrete Random Variables
    04:48

Binomial Distribution

  • Guided course
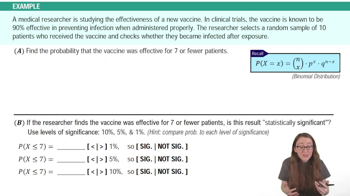
    Finding Binomial Probabilities Using TI-84 Example 1
    03:33
  • Guided course
    Finding Binomial Probabilities Using TI-84 Example 2
    04:20
  • Guided course
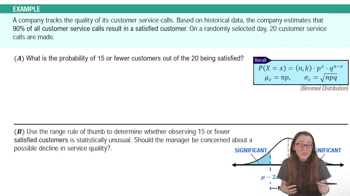
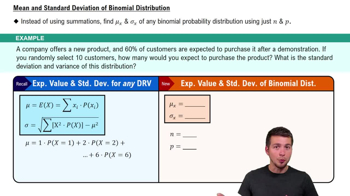
    Mean & Standard Deviation of Binomial Distribution
    03:28

Confidence Intervals for Population Proportion

  • Guided course
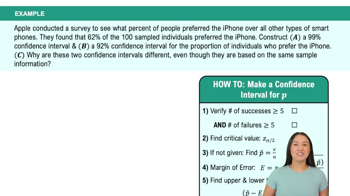
    Constructing Confidence Intervals for Proportions Example 1
    06:38
  • Guided course
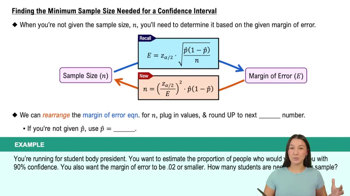
    Finding the Minimum Sample Size Needed for a Confidence Interval
    04:08
  • Guided course
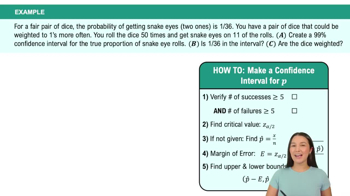
    Constructing Confidence Intervals for Proportions Example 2
    04:24

Steps in Hypothesis Testing

  • Guided course
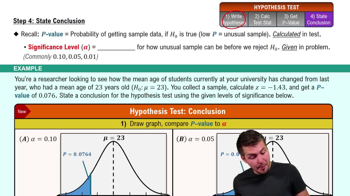
    Step 4: State Conclusion
    09:56
  • Guided course
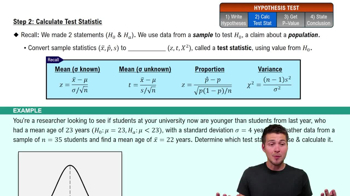
    Step 2: Calculate Test Statistic
    06:34
  • Guided course
    Step 1: Write Hypotheses
    06:21