Back

Displaying and Describing Categorical Data: Contingency Tables, Conditional Distributions, and Graphical Summaries

Study Guide - Learn with Videos

Curated lessons matched to your uploaded material – learn every topic step by step.

Contingency Tables

  • Guided course
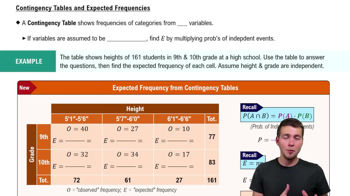
    Contingency Tables & Expected Frequencies
    08:18

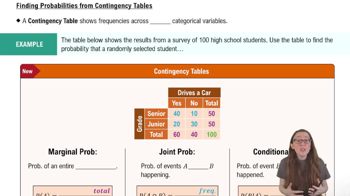
Introduction to Contingency Tables

  • Guided course
    Introduction to Contingency Tables
    05:35
  • Guided course
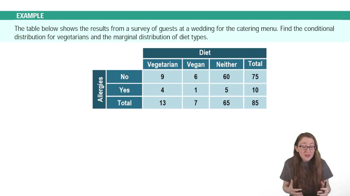
    Introduction to Contingency Tables Example 2
    03:05
  • Guided course
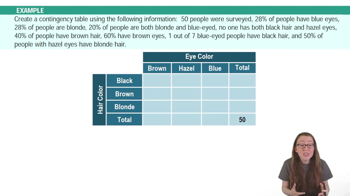
    Introduction to Contingency Tables Example 1
    04:15

Chi Square Distribution

  • Guided course
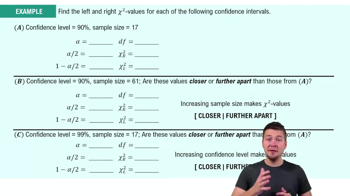
    Critical Values: Chi Square Distribution Example 2
    05:18
  • Guided course
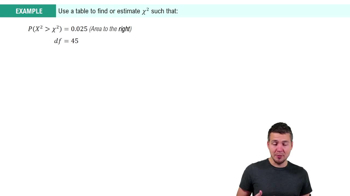
    Critical Values: Chi Square Distribution Example 1
    03:55
  • Guided course
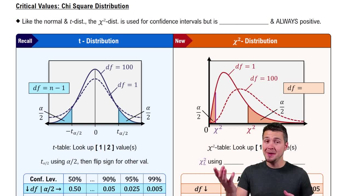
    Critical Values: Chi Square Distribution
    05:39

Goodness of Fit Test

  • Guided course
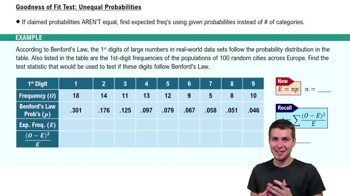
    Goodness of Fit Test: Unequal Probabilities
    05:24
  • Guided course
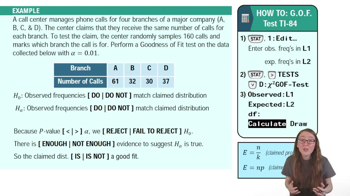
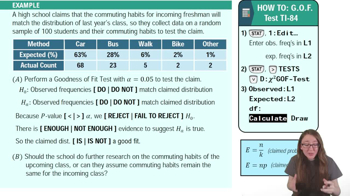
     Goodness of Fit Test Example 1
    08:49
  • Guided course
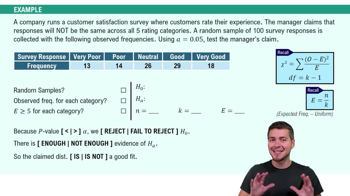
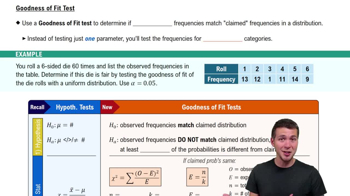
    Goodness of Fit Test
    10:17

Goodness of FIt Test Using TI-84

  • Guided course
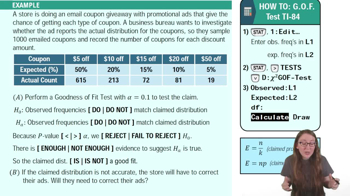
    Goodness of Fit Test Using a TI-84 Example 2
    03:55
  • Guided course
    Goodness of Fit Test Using a TI-84 Example 1
    02:50
  • Guided course
    Goodness of Fit Test Using a TI-84 Example 3
    03:25

Goodness of Fit Test - Excel

  • Guided course
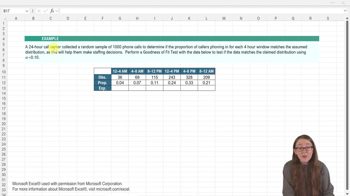
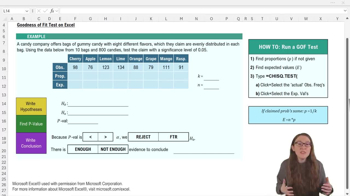
    Goodness of FIt Test - Excel Example 1
    04:24
  • Guided course
    Goodness of FIt Test - Excel
    05:54

Bar Graphs and Pareto Charts

  • Guided course
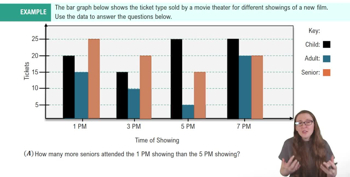
    Bar Graphs and Pareto Charts Example 1
    05:26
  • Guided course
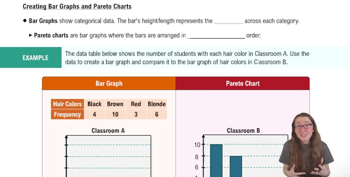
    Creating Bar Graphs and Pareto Charts
    04:52

Pie Charts

  • Guided course
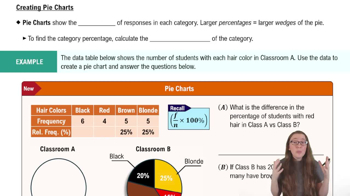
    Creating Pie Charts
    06:10
  • Guided course
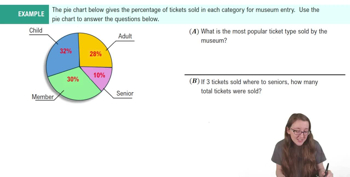
    Pie Charts Example 1
    01:18

Frequency Distributions

  • Guided course
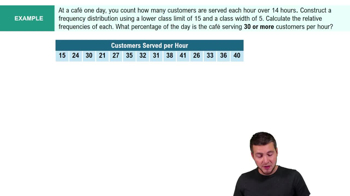
    Intro to Frequency Distributions Example 1
    06:19
  • Guided course
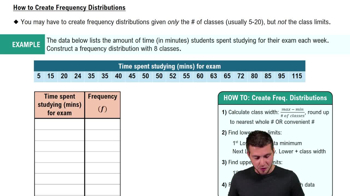
    How to Create Frequency Distributions
    06:29
  • Guided course
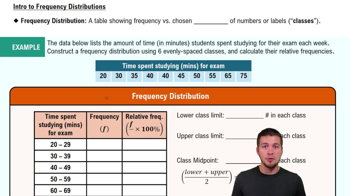
    Intro to Frequency Distributions
    06:38