 Back
BackEssential Study Notes for Introductory Statistics: Data Collection, Description, and Probability
Study Guide - Smart Notes
 Tailored notes based on your materials, expanded with key definitions, examples, and context.
Collecting Data in Statistics
Statistics: Understanding Variability
Statistics is the science focused on collecting, analyzing, and drawing conclusions from data. The central theme is variability, which refers to differences observed in data values.
Population: The entire set of subjects or objects of interest.
Sample: A subset of the population selected for study.
Observational Study: The researcher observes characteristics of a sample from one or more populations without intervention.
Experiment: The researcher manipulates conditions to observe effects on a response variable.
Types of Statistical Studies
Observational Study: Used to learn about populations by observing samples. Requires representative sampling.
Experiment: Used to investigate effects of treatments or conditions. Requires comparable experimental groups.
Sampling Methods
Simple Random Sample: Every possible sample of size n has an equal chance of being selected.
Sampling with Replacement: Selected individuals are returned to the population before the next selection.
Sampling without Replacement: Selected individuals are not returned, ensuring distinct selections.
Describing Data with Tables and Graphs
Types of Data and Variables
Univariate: One variable per observation.
Bivariate: Two variables per observation.
Multivariate: More than two variables per observation.
Categorical Variables: Qualitative, such as color or gender.
Numerical Variables: Quantitative, either discrete (counted) or continuous (measured).
Graphical Displays for Categorical Data
Bar Chart: Visualizes frequency or relative frequency of categories.
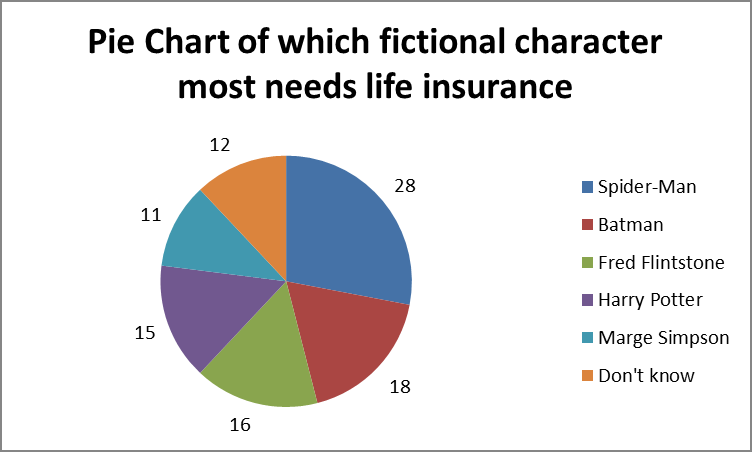
Pie Chart: Represents proportions of categories as slices of a circle.
Example: Survey on which fictional character most needs life insurance, visualized as a pie chart.
Graphical Displays for Numerical Data
Stem-and-Leaf Display: Compact summary for small to moderate data sets.
Histogram: Graph of frequency distribution for discrete or continuous numerical data.
Numerical Methods for Describing Data Distributions
Measures of Center
Measures of center describe the typical value in a data set.
Mean: Arithmetic average.
Median: Middle value when data are ordered.
Mode: Most frequently occurring value.
Measures of Spread
Measures of spread describe variability in the data.
Range: Difference between largest and smallest values.
Variance: Average squared deviation from the mean.
Standard Deviation: Square root of variance.
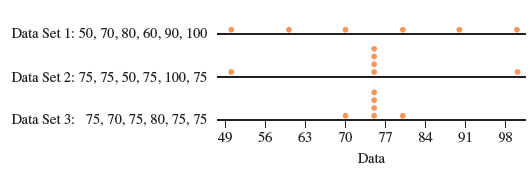
Example: Three data sets with the same mean but different variability.
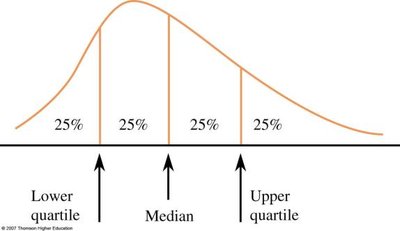
Quartiles and Interquartile Range (IQR)
Lower Quartile (Q1): 25th percentile
Median (Q2): 50th percentile
Upper Quartile (Q3): 75th percentile
Interquartile Range:
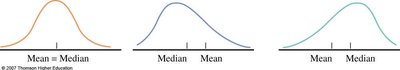
Mean, Median, and Skewness
The relationship between mean and median indicates skewness:
Symmetric Distribution: Mean = Median
Positively Skewed: Mean > Median
Negatively Skewed: Mean < Median
Measures of Relative Standing: z-scores
z-score: Number of standard deviations a value is from the mean.
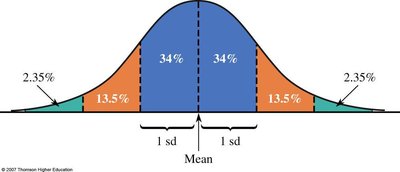
The Empirical Rule
For mound-shaped, symmetric distributions:
68% of values within 1 standard deviation
95% within 2 standard deviations
99.7% within 3 standard deviations
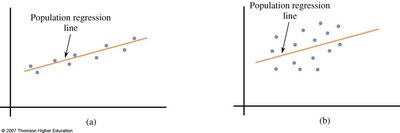
Describing Bivariate Numerical Data
Scatterplots
Scatterplots display relationships between two numerical variables. Patterns may be linear or nonlinear, positive or negative, or show no relationship.
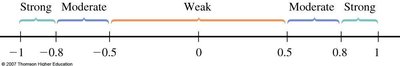
Correlation
Pearson's Correlation Coefficient (r): Measures strength and direction of linear relationship.
r ranges from -1 (perfect negative) to +1 (perfect positive).
Regression: Fitting a Line to Bivariate Data
Linear Regression Model
Regression Equation:
Slope (b): Change in y for a one-unit increase in x.
Intercept (a): Value of y when x = 0.
Residual: Difference between observed and predicted y.
Coefficient of Determination (R2)
Proportion of variation in y explained by the model.
Probability
Chance Experiments and Sample Spaces
Chance Experiment: Activity with uncertain outcome.
Sample Space: Set of all possible outcomes.
Event: Any collection of outcomes.
Simple Event: Event with exactly one outcome.
Basic Probability Rules
Probability of an event:
0 ≤ P(E) ≤ 1
P(Sample Space) = 1
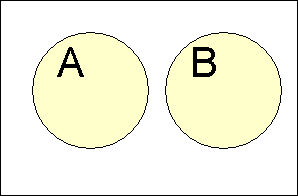
If events are disjoint:
P(E) + P(Ec) = 1
Conditional Probability
Probability of E given F:
Independence
Events A and B are independent if
Multiplication rule for independent events:
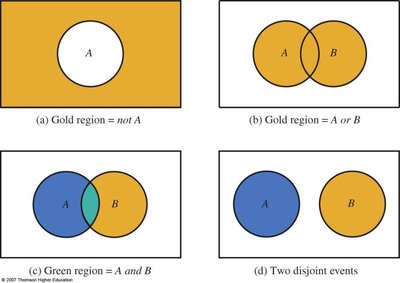
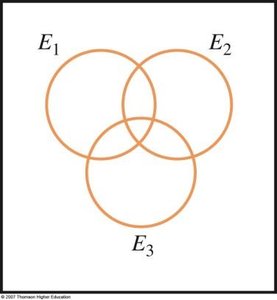
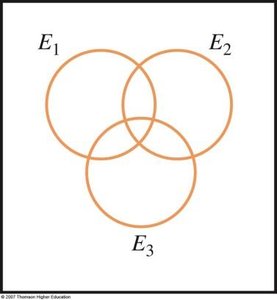
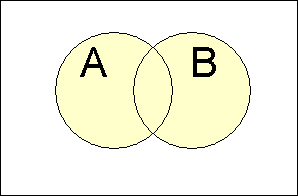
Venn Diagrams and Probability
Venn diagrams are used to visualize relationships between events, such as union, intersection, and disjointness.
General Addition Rule
For any two events:
General Multiplication Rule
For any two events:
Additional info: These notes cover the foundational concepts in statistics, including data collection, graphical and numerical data description, bivariate analysis, and probability. All images included are directly relevant to the explanations provided.
