Back
Essential Study Notes for Introductory Statistics: Data Collection, Description, and Probability
Study Guide - Learn with Videos
 Curated lessons matched to your uploaded material – learn every topic step by step.
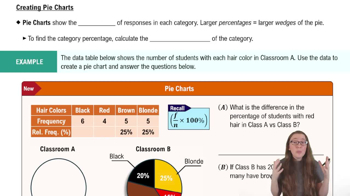
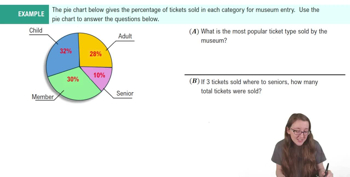
Pie Charts
- Guided course
 06:10

- Guided course 01:18
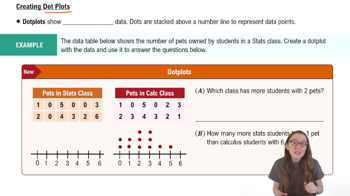
Dot Plots
- Guided course 04:01
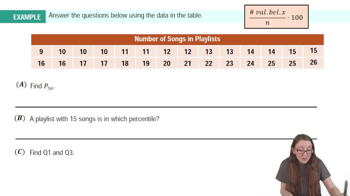
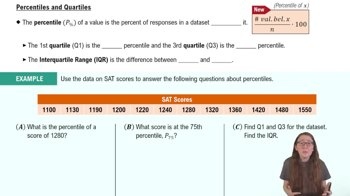
Percentiles & Quartiles
- Guided course 04:30
- Guided course 07:11
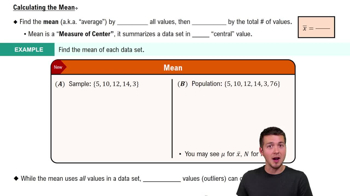
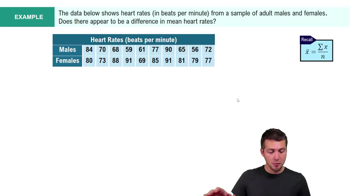
Mean
- Guided course 04:52
- Guided course 03:08
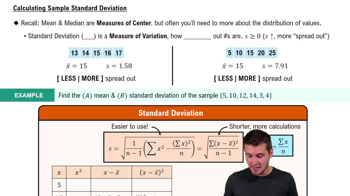
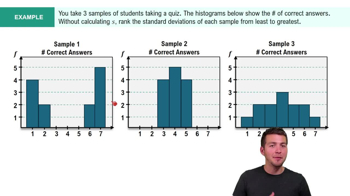
Standard Deviation
- Guided course 08:45
- Guided course 02:59
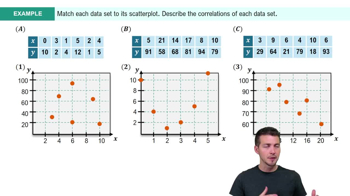
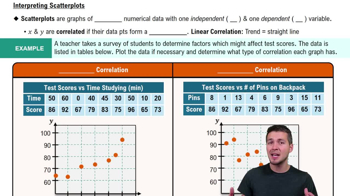
Scatterplots & Intro to Correlation
- Guided course 05:14
- Guided course 06:36
- Guided course 05:26
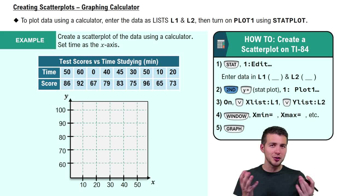
Correlation Coefficient
- Guided course 05:43
- Guided course 04:40
- Guided course 03:44
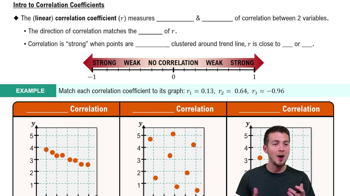
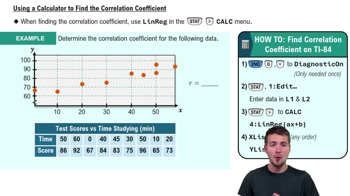
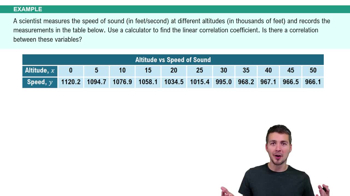
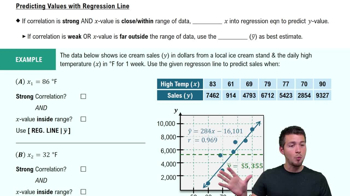
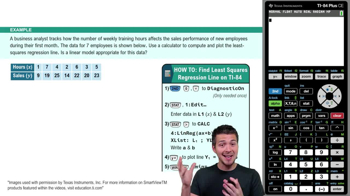
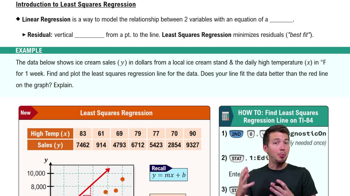
Linear Regression & Least Squares Method
- Guided course 04:57
- Guided course 05:02
- Guided course 07:01
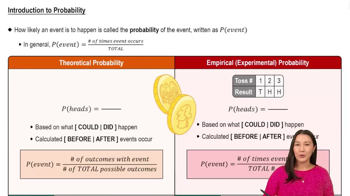
Basic Concepts of Probability
- Guided course 5:37