 Back
Introduction to Statistics: Key Concepts and Foundations
Study Guide - Smart Notes
 Tailored notes based on your materials, expanded with key definitions, examples, and context.
Introduction to Statistics
Overview of Statistics
Statistics is the science of collecting, organizing, analyzing, and interpreting data to make decisions. It is fundamental for understanding and evaluating information in various fields, including business, health, and social sciences.
Definition: Statistics involves methods for gathering and analyzing data to draw meaningful conclusions.
Purpose: To become an informed consumer, understand statistical studies, and sharpen critical thinking skills.
Data: Information obtained from observations, counts, measurements, or responses.
Example: "Most U.S. adults today say they use the internet (95%), have a smartphone (90%), or subscribe to high-speed internet at home (80%)."
What is Data?
Data are the raw facts and figures collected from observations, counts, measurements, or responses. They form the basis for statistical analysis.
Types of Data: Observational, count, measurement, response.
Example: Survey results about technology usage among U.S. adults.
Data Sets: Population and Sample
Population vs. Sample
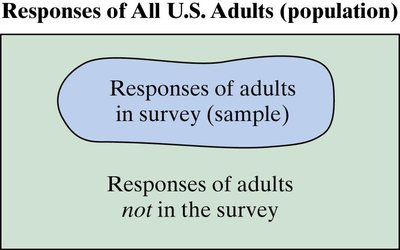
Understanding the distinction between population and sample is crucial in statistics. The population is the entire group of interest, while a sample is a subset of the population used for analysis.
Population: The collection of all outcomes, responses, measurements, or counts that are of interest.
Sample: A subset, or part, of the population.
Example: In a survey of 1152 adults in the United States, the population is all U.S. adults, and the sample is the 1152 surveyed adults.


Identifying Data Sets
When conducting a study, it is important to clearly identify the population and sample, as well as describe the sample data set.
Example: In a survey, 207 adults said they would likely buy an EV, and 945 said they would not. The sample data set consists of these responses.
Parameter and Statistic
Definitions and Distinctions
Parameters and statistics are numerical descriptions of characteristics. A parameter describes a population, while a statistic describes a sample.
Parameter: A numerical description of a population characteristic.
Statistic: A numerical description of a sample characteristic.
Study Tip: Match the first letters: population parameter, sample statistic.
Examples: Parameter vs. Statistic
Sample Statistic: The average weekly grocery store spend of $165 is based on a subset of U.S. households.
Population Parameter: The average SAT math score of 514 for the entire freshman class.
Sample Statistic: 34% of retail stores not storing fish at proper temperature, based on a random check.
Branches of Statistics
Descriptive Statistics
Descriptive statistics involve the organization, summarization, and display of data. Common tools include tables, charts, and averages.
Purpose: To describe and summarize data.
Examples: Frequency tables, bar charts, mean, median.


Inferential Statistics
Inferential statistics use sample data to draw conclusions about a population. This branch allows for predictions and generalizations beyond the observed data.
Purpose: To make inferences about populations based on sample data.
Examples: Estimating population parameters, hypothesis testing.

Descriptive and Inferential Statistics in Practice
Example: Moving Costs Study
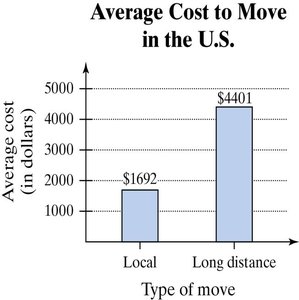
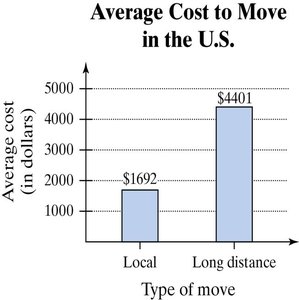
Studies often involve both descriptive and inferential statistics. For example, a study of 1000 U.S. adults who relocated found the average cost to move locally is $1692, and long distance is $4401.
Population: All U.S. adults who relocated in the last five years.
Sample: 1000 U.S. adults in the study.
Descriptive Statistics: The average costs reported.
Inferential Statistics: Concluding that a long-distance move costs at least 2.5 times more than a local move.
Example: Workplace Mental Health Study
Another study surveyed 1541 U.S. workers, finding that 39% worry about negative impacts if they disclose a mental health condition to their employer.
Population: All U.S. workers.
Sample: 1541 U.S. workers in the study.
Descriptive Statistics: The percentage reported.
Inferential Statistics: Concluding that nearly two in five U.S. workers share this concern.
Summary Table: Population vs. Sample, Parameter vs. Statistic
Concept | Definition | Example |
|---|---|---|
Population | Entire group of interest | All U.S. adults |
Sample | Subset of the population | 1152 surveyed adults |
Parameter | Numerical description of a population | Average SAT score of all freshmen |
Statistic | Numerical description of a sample | Average grocery spend from surveyed households |
Key Formulas
Sample Mean:
Population Mean:
