 Back
Introductory Statistics Study Guide: Data Collection, Sampling, and Data Summarization
Study Guide - Smart Notes
 Tailored notes based on your materials, expanded with key definitions, examples, and context.
Section 1: Introduction to Statistics
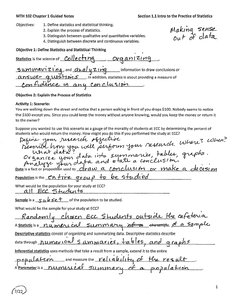
Definition and Purpose of Statistics
Statistics is the science of collecting, organizing, summarizing, and analyzing data to answer questions and draw conclusions. It is used to make sense of data and inform decision-making, but conclusions are only as reliable as the data and methods used.
Population: The entire group to be studied.
Sample: A subset of the population, selected for study.
Parameter: A numerical summary of a population.
Statistic: A numerical summary of a sample.
Inference: Using sample data to make generalizations about a population.
Section 2: Types of Variables
Qualitative vs. Quantitative Variables
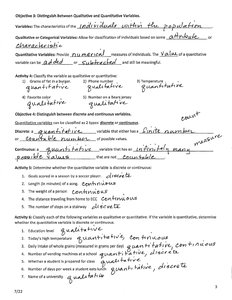
Variables are characteristics of individuals within a population. They are classified as either qualitative (categorical) or quantitative (numerical).
Qualitative Variables: Describe attributes or characteristics (e.g., color, gender).
Quantitative Variables: Provide numerical measures (e.g., height, weight).
Discrete Quantitative: Countable values (e.g., number of siblings).
Continuous Quantitative: Measurable values within a range (e.g., weight).
Section 3: Observational Studies vs. Designed Experiments
Types of Studies
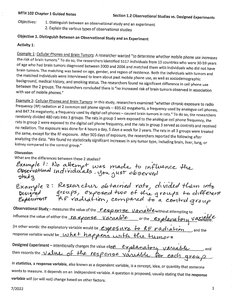
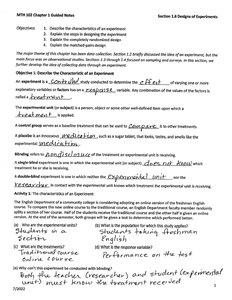
Statistical studies are classified as observational or experimental. Observational studies involve observing subjects without intervention, while experiments involve manipulating variables to observe effects.
Observational Study: No attempt is made to influence the subjects; just observe.
Designed Experiment: Researcher manipulates variables and assigns subjects to groups.
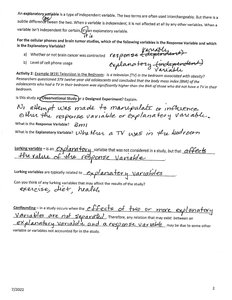
Explanatory Variable: The variable manipulated or considered as the cause.
Response Variable: The outcome measured.
Confounding Variable: An explanatory variable that cannot be distinguished from another in the study.
Section 4: Types of Sampling Methods
Simple Random Sampling
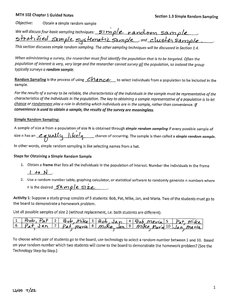
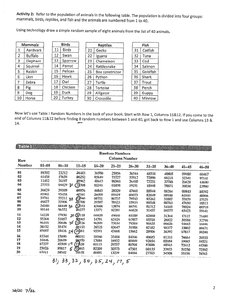
Simple random sampling ensures every individual in the population has an equal chance of being selected. This method is fundamental for unbiased data collection.
Random Sampling: Selection by chance.
Simple Random Sample: Each possible sample of a given size has the same chance of being chosen.
Other Sampling Methods
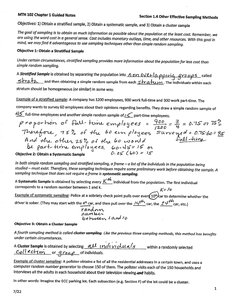
Other effective sampling methods include stratified, systematic, and cluster sampling. These methods are used to improve efficiency and reduce cost.
Stratified Sampling: Population divided into groups (strata), and random samples taken from each.
Systematic Sampling: Select every nth individual from a list.
Cluster Sampling: Population divided into clusters, and entire clusters are randomly selected.
Section 5: Bias in Sampling
Sources of Bias
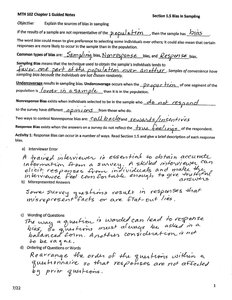
Bias occurs when the results of a sample are not representative of the population. Common sources include sampling bias, nonresponse bias, and response bias.
Sampling Bias: Sample is not representative of the population.
Nonresponse Bias: Individuals selected do not respond.
Response Bias: Responses are influenced by wording or interviewer.
Section 6: Organizing and Summarizing Data
Organizing Qualitative Data
Qualitative data is organized into tables and graphs to summarize categories and frequencies.
Frequency Distribution: Shows counts for each category.
Relative Frequency: Proportion of each category relative to the total.
Bar Graphs and Pie Charts
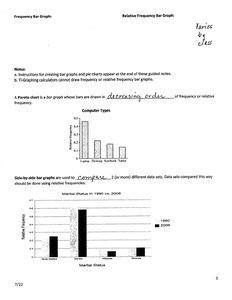
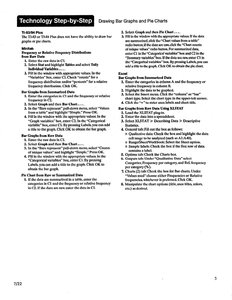
Bar graphs and pie charts are used to visually represent qualitative data. Bar graphs compare frequencies across categories, while pie charts show proportions as sectors of a circle.
Bar Graph: Categories on one axis, frequencies on the other.
Pie Chart: Circle divided into sectors, each representing a category's proportion.
Organizing Quantitative Data
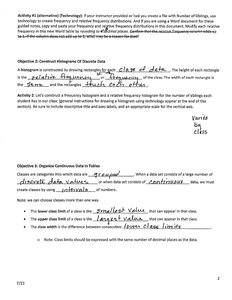
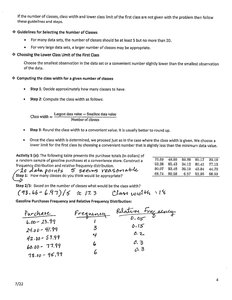
Quantitative data is organized into frequency distributions, histograms, and tables. Data can be discrete or continuous, and is grouped into classes for summarization.
Discrete Data: Countable values, often organized by frequency.
Continuous Data: Measurable values, grouped into intervals (classes).
Histogram: Bar graph for quantitative data, showing frequency or relative frequency for each class.
Time-Series Graphs
Time-series graphs display data measured at different points in time, showing trends and patterns.
Time-Series Data: Data collected over time, plotted with time on the horizontal axis.
Section 7: Steps in Designing Experiments
Conducting an Experiment
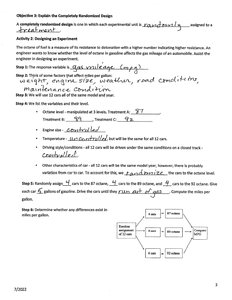
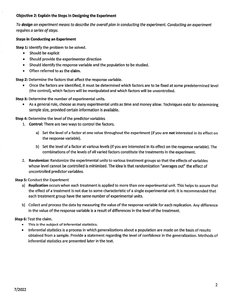
Designing an experiment involves identifying the objective, determining factors, selecting subjects, applying treatments, and measuring responses.
Step 1: Identify the research objective.
Step 2: Determine factors affecting the response variable.
Step 3: Select subjects and assign treatments.
Step 4: Conduct the experiment and collect data.
Step 5: Analyze results and draw conclusions.
Completely Randomized and Matched-Pairs Designs
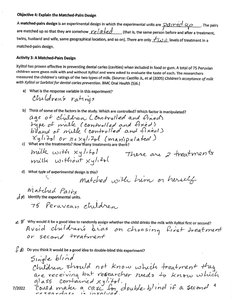
Experimental designs include completely randomized and matched-pairs designs. In a completely randomized design, subjects are randomly assigned to treatments. In a matched-pairs design, subjects are paired based on similarities and each pair receives different treatments.
Completely Randomized Design: Subjects randomly assigned to groups.
Matched-Pairs Design: Subjects paired and each pair receives different treatments.
Section 8: Formulas and Equations
Key Statistical Formulas
Relative Frequency:
Class Width:
Section 9: Tables for Comparison and Classification
Sample Table: Frequency Distribution
This table summarizes the frequency and relative frequency of gasoline purchases.
Class | Frequency | Relative Frequency |
|---|---|---|
10.00-19.99 | 6 | 0.3 |
20.00-29.99 | 9 | 0.45 |
30.00-39.99 | 5 | 0.25 |
Sample Table: Animal Population Sampling
This table shows the population of animals divided into four groups and their assigned numbers for random sampling.
Group | Animal | Number |
|---|---|---|
Mammals | Bear | 1 |
Birds | Robin | 11 |
Reptiles | Snake | 21 |
Fish | Trout | 31 |
... | ... | ... |
Section 10: Summary
This study guide covers foundational concepts in introductory statistics, including data collection, types of variables, study designs, sampling methods, bias, and data summarization. Understanding these concepts is essential for analyzing data and making informed decisions based on statistical evidence.
