 Back
Sampling and Survey Design in Introductory Statistics
Study Guide - Smart Notes
 Tailored notes based on your materials, expanded with key definitions, examples, and context.
Sampling and Survey Design
Understanding Populations and Samples
In statistics, a population refers to the entire group of individuals or items that we are interested in studying. A sample is a subset of the population, selected for analysis to make inferences about the population as a whole. The goal of sampling is to obtain a representative group so that conclusions drawn from the sample can be generalized to the population.
Population Parameter: A numerical summary describing a characteristic of the population (e.g., mean, standard deviation, proportion).
Sample Statistic: A numerical summary describing a characteristic of the sample, used to estimate the population parameter.
Examples of Populations: Cholesterol levels of male Native Americans, income of banking executives, GPA of students owning iPads, percent of cars with underinflated tires.
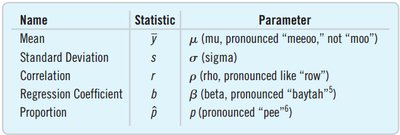
Notation: Greek letters are typically used for parameters (e.g., μ, σ), while Latin letters are used for statistics (e.g., ȳ, s).
Sample Size and Representativeness
The size of the sample and the method of selection are crucial for representativeness. The actual size of the population is less important than the sample size and how the sample is chosen. For example, to estimate a proportion with a margin of error of 3%, a sample size slightly over 1000 is often sufficient, regardless of whether the population is a county or the entire country.
Sampling Frame: The list or collection from which the sample is drawn. If the frame misses part of the population, it is considered biased.
Sample Design: The method used to select the sample from the population.
Types of Sampling Bias
Sampling bias occurs when the sample does not accurately represent the population. Common types include:
Voluntary Response Bias: Occurs when individuals choose to participate, often leading to overrepresentation of those with strong opinions.
Convenience Sampling: Sampling individuals who are easiest to reach, which may not represent the population.
Undercoverage: Some groups in the population are left out or underrepresented in the sample.
Nonresponse Bias: Individuals selected for the sample do not respond, and their opinions may differ from those who do respond.
Response Bias: External factors, such as question wording or interviewer behavior, influence responses.
Sampling Methods
Several sampling designs are used to obtain representative samples:
Simple Random Sample (SRS): Every member of the population has an equal chance of being selected. Used when the entire population is accessible.
Systematic Sample: Every k-th member of the population is selected, starting from a randomly chosen point.
Stratified Random Sample: The population is divided into homogeneous groups (strata), and a random sample is taken from each stratum. This method reduces bias when groups differ from each other.
Cluster Sample: The population is divided into clusters, which are similar to each other. A few clusters are randomly selected, and all members within those clusters are surveyed. Useful when simple random sampling is impractical.
Multistage Sample: Combines several sampling methods, often used in large-scale surveys.
Comparison of Stratified and Cluster Sampling
Stratified Sampling: Strata are homogeneous within but differ from each other; random samples are taken from each stratum.
Cluster Sampling: Clusters are heterogeneous and resemble the overall population; entire clusters are randomly selected and surveyed.
Examples of Sampling Designs
Systematic Sample Example: Police officers stop every 10th car to check for alcohol use.
Cluster Sample Example: An academic officer surveys all students in 25 randomly chosen classrooms.
Stratified Sample Example: Students from both main and agricultural campuses are randomly selected to answer a survey about parking.
Designing a Valid Survey
To ensure a valid survey, consider:
Clearly define what you want to know.
Ask the right respondents and the right questions.
Ensure that the answers will address your research questions.
Name | Statistic | Parameter |
|---|---|---|
Mean | \( \bar{y} \) | \( \mu \) |
Standard Deviation | \( s \) | \( \sigma \) |
Correlation | \( r \) | \( \rho \) |
Regression Coefficient | \( b \) | \( \beta \) |
Proportion | \( \hat{p} \) | \( p \) |
Additional info: The above table summarizes the notation for common statistics and their corresponding population parameters, which is essential for interpreting results in inferential statistics.
