Back

Statistics Practice Exam Guidance – Visuals, Probability, and Data Analysis

Study Guide - Learn with Videos

Curated lessons matched to your uploaded material – learn every topic step by step.

Histograms

  • Guided course
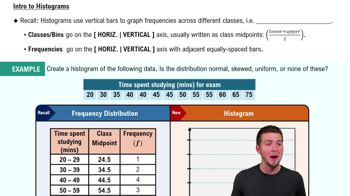
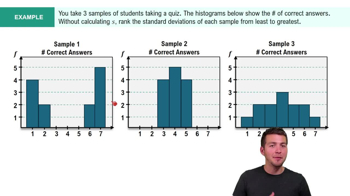
    Intro to Histograms
    05:54
  • Guided course
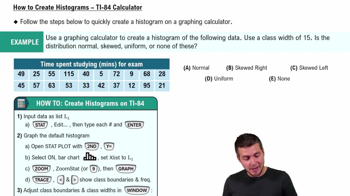
    How to Create Histogram - TI-84 Calculator
    07:10

Scatterplots & Intro to Correlation

  • Guided course
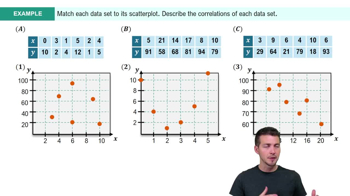
    Scatterplots & Intro to Correlation Example 1
    05:14
  • Guided course
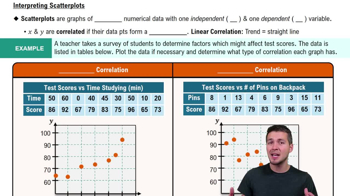
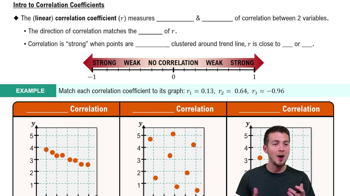
    Scatterplots & Intro to Correlation
    06:36
  • Guided course
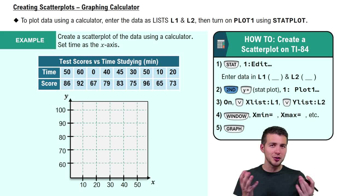
    Creating Scatterplots - Graphing Calculator
    05:26

Correlation Coefficient

  • Guided course
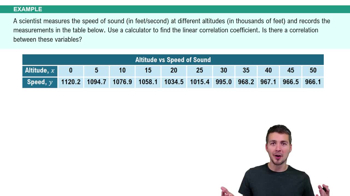
    Correlation Coefficient
    05:43
  • Guided course
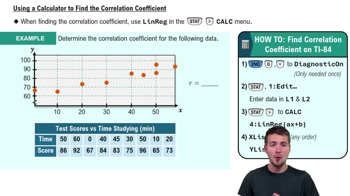
    Calculating Correlation Coefficient - Graphing Calculator
    04:40
  • Guided course
    Calculating Correlation Coefficient - Graphing Calculator Example 1
    03:44

Boxplots

  • Guided course
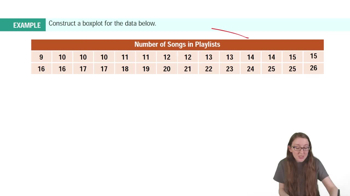
    Boxplots Example 1
    01:52
  • Guided course
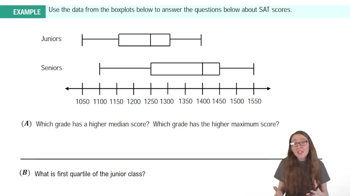
    Boxplots Example 2
    02:48
  • Guided course
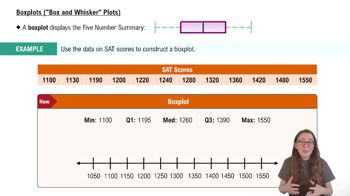
    Boxplots ("Box and Whisker Plots")
    03:54

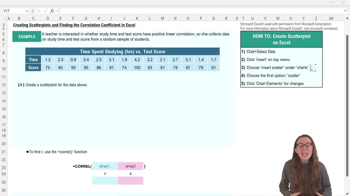
Creating Scatterplots and Finding Correlation Coefficient - Excel

  • Guided course
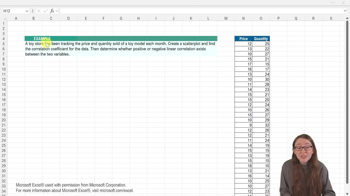
    Creating Scatterplots and Finding Correlation Coefficient - Excel Example 1
    02:32
  • Guided course
    Creating Scatterplots and Finding Correlation Coefficient - Excel
    04:09

Mean

  • Guided course
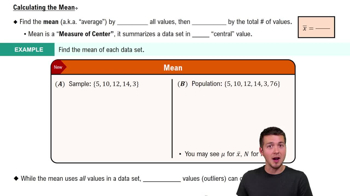
    Calculating the Mean
    04:52
  • Guided course
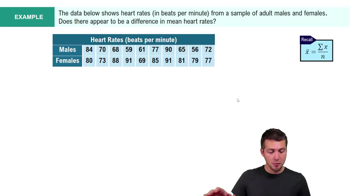
     Calculating the Mean Example 1
    03:08

Standard Deviation

  • Guided course
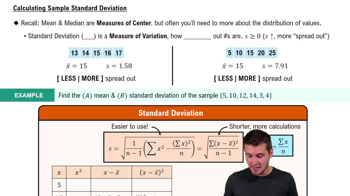
    Calculating Standard Deviation
    08:45
  • Guided course
    Calculating Standard Deviation Example 1
    02:59

Basic Concepts of Probability

  • Guided course
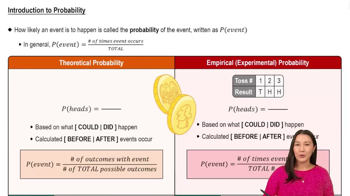
    Introduction to Probability
    5:37