
Basics of Graphing quiz #1 Flashcards

Basics of Graphing quiz #1
Control buttons has been changed to "navigation" mode.
1/10
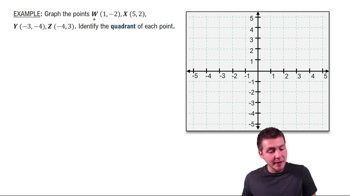
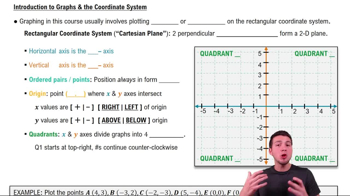
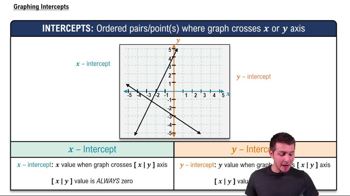
  • What are the key geometric vocabulary terms used in the rectangular coordinate system, and what do they mean?
    Key geometric vocabulary terms in the rectangular coordinate system include: (1) Origin: the point (0, 0) where the x-axis and y-axis intersect; (2) Axes: the horizontal axis is called the x-axis, and the vertical axis is called the y-axis; (3) Ordered pair: a point described by two numbers (x, y) representing its position on the plane; (4) Quadrants: the four regions created by the intersection of the axes, numbered I to IV counterclockwise starting from the upper right; (5) Intercepts: x-intercept is where a graph crosses the x-axis (y = 0), and y-intercept is where it crosses the y-axis (x = 0).
  • What is the rectangular coordinate system also known as, and what does it consist of?
    The rectangular coordinate system is also called the Cartesian plane and consists of two perpendicular number lines, the x-axis and y-axis, that intersect at the origin. This forms a two-dimensional grid for plotting points with ordered pairs.
  • How do you plot the point (0, -3) on the coordinate plane?
    To plot (0, -3), start at the origin, do not move left or right, and move down 3 units along the y-axis. The point will be located directly below the origin on the y-axis.
  • What is the significance of the sign of the x and y values in an ordered pair when plotting points?
    The sign of the x value determines left (negative) or right (positive) movement from the origin, while the sign of the y value determines up (positive) or down (negative) movement. This helps locate the point in the correct quadrant.
  • How are the four quadrants of the coordinate plane numbered and in which direction?
    The four quadrants are numbered I to IV, starting from the upper right and moving counterclockwise. Quadrant I is upper right, II is upper left, III is lower left, and IV is lower right.
  • What does it mean for a point to satisfy a two-variable equation like x + y = 5?
    A point satisfies the equation if substituting its x and y values into the equation makes it true. Only such points will lie on the graph of the equation.
  • What is the process for graphing a linear equation such as -2x + y = -1?
    First, isolate y to get y in terms of x, then choose several x values, calculate the corresponding y values, and plot the resulting ordered pairs. Finally, connect the points with a straight line.
  • Why is it helpful to use a table when graphing equations with two variables?
    A table helps organize chosen x values and their corresponding calculated y values, making it easier to plot accurate points. This systematic approach ensures the graph is drawn correctly.
  • What is always true about the y value at any x-intercept of a graph?
    At any x-intercept, the y value is always zero. This is because the point lies directly on the x-axis.
  • How do you determine whether to write just the value or the ordered pair when asked for intercepts?
    If the question specifically asks for x-intercepts or y-intercepts, write just the x or y value; if it asks for intercepts without specifying, write the full ordered pair. This distinction depends on the wording of the problem.