Skip to main content
Trigonometry
My Course
Learn
Exam Prep
AI Tutor
Study Guides
Textbook Solutions
Flashcards
Explore
Try the app
My Course
Learn
Exam Prep
AI Tutor
Study Guides
Textbook Solutions
Flashcards
Explore
Try the app
Back
Graphing Parametric Equations definitions
You can tap to flip the card.
Parametric Equations
You can tap to flip the card.
👆
Parametric Equations
Expressions where two variables are written in terms of a third variable, typically used to describe motion or curves.
Track progress
Control buttons has been changed to "navigation" mode.
1/15
Related flashcards
Related practice
Recommended videos
Graphing Parametric Equations quiz #1
Graphing Parametric Equations
10 Terms
Graphing Parametric Equations
10. Parametric Equations
1 problem
Topic
ErnestBlazevic
Eliminate the Parameter
10. Parametric Equations
1 problem
Topic
AllySteele
10. Parametric Equations
1 topic
2 problems
Chapter
04:47
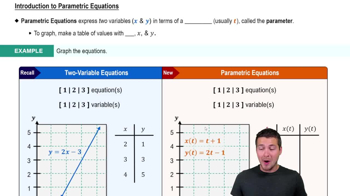
Introduction to Parametric Equations
751
views
1
comments
Terms in this set (15)
Hide definitions
Parametric Equations
Expressions where two variables are written in terms of a third variable, typically used to describe motion or curves.
Parameter
A third variable, often labeled t, that determines the values of other variables in a set of equations.
Plane Curve
A set of points in a plane traced by parametric equations, forming shapes like lines, parabolas, or more complex figures.
Orientation
The direction indicated on a graph, showing how the curve progresses as the parameter increases.
Table of Values
A chart listing the parameter and corresponding x and y values, used to organize points for graphing.
Coordinate Pair
A set of x and y values derived from the parameter, representing a point on the graph.
Arrow
A graphical symbol used to show the direction of increasing parameter values along a curve.
x(t)
An expression for the x-coordinate as a function of the parameter, used to generate graph points.
y(t)
An expression for the y-coordinate as a function of the parameter, used to generate graph points.
Axis
A reference line on a graph; in parametric graphs, the parameter does not have its own axis.
Line
A straight shape that can be represented by parametric equations, connecting plotted points.
Parabola
A curved shape that can be described by parametric equations, often appearing in more complex graphs.
Graph
A visual representation of points generated from parametric equations, showing their relationship in the plane.
Input
A value for the parameter used to calculate corresponding x and y values in parametric equations.
Output
The resulting x and y values obtained from substituting the parameter into the equations.
 BackBack

 04:47
04:47