 Back
BackTrigonometric Functions and Their Graphs: Step-by-Step Guidance
Study Guide - Smart Notes
 Tailored notes based on your materials, expanded with key definitions, examples, and context.
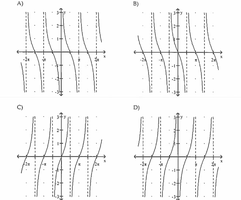
Q1. Match the function with its graph: y = tan x, y = cot x, y = -tan x, y = -cot x
Background
Topic: Graphs of Trigonometric Functions
This question tests your ability to recognize the graphs of tangent and cotangent functions, including their negative counterparts.
Key Terms and Formulas:
Tangent function:
Cotangent function:
Negative tangent:
Negative cotangent:
Vertical asymptotes occur where the function is undefined.
Step-by-Step Guidance
Review the basic shapes of and graphs. $\tan x$ has vertical asymptotes at , and $\cot x$ at .
Identify the direction of the curve: increases from left to right, decreases.
Negative versions flip the graph across the x-axis.
Compare each graph to these properties to match the function to the correct graph.
Try solving on your own before revealing the answer!
Final Answer:
Match the functions to the graphs using the properties above. The correct matching is: 1A, 2B, 3C, 4D.
This is based on the direction and asymptotes of each graph.
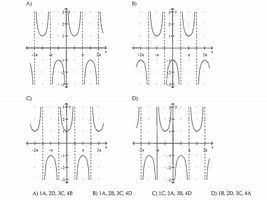
Q2. Match the function with its graph: y = sec x, y = csc x, y = -sec x, y = -csc x
Background
Topic: Graphs of Reciprocal Trigonometric Functions
This question tests your ability to identify the graphs of secant and cosecant functions, including their negative forms.
Key Terms and Formulas:
Secant function:
Cosecant function:
Negative secant:
Negative cosecant:
Vertical asymptotes occur where the original sine or cosine function is zero.
Step-by-Step Guidance
Recall that is the reciprocal of , and is the reciprocal of .
Identify the locations of vertical asymptotes: at , at .
Negative versions flip the graph across the x-axis.
Compare the graphs to these properties to match each function.
Try solving on your own before revealing the answer!
Final Answer:
Match the functions to the graphs using the properties above. The correct matching is: 1C, 2A, 3B, 4D.
This is based on the reciprocal relationships and asymptotes.
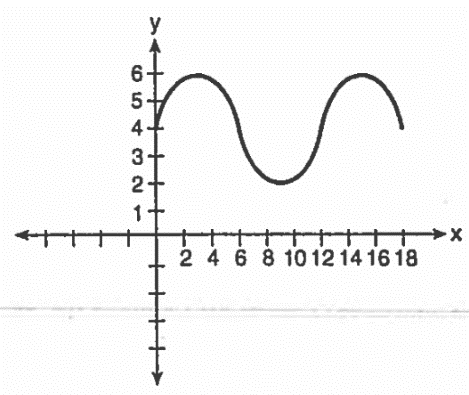
Q3. What is the amplitude of the function shown in the accompanying graph?
Background
Topic: Amplitude of Trigonometric Functions
This question tests your ability to determine the amplitude from a graph of a sine or cosine function.
Key Terms and Formulas:
Amplitude: The maximum distance from the midline (average value) to the peak of the graph.
For or , amplitude is .
Step-by-Step Guidance
Identify the midline of the graph (the horizontal line halfway between the maximum and minimum values).
Find the maximum and minimum values of the function on the graph.
Calculate the amplitude as half the distance between the maximum and minimum values: .
Try solving on your own before revealing the answer!
Final Answer:
The amplitude is 2.5, calculated from the maximum and minimum values on the graph.
This is the distance from the midline to the peak.
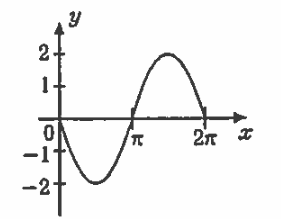
Q4. Which equation is represented in the graph shown?
Background
Topic: Identifying Trigonometric Equations from Graphs
This question tests your ability to match a graph to its corresponding trigonometric equation based on amplitude, period, and phase shift.
Key Terms and Formulas:
Sine and cosine functions: or
Amplitude:
Period:
Step-by-Step Guidance
Examine the graph for amplitude (height), period (length of one cycle), and whether it is a sine or cosine function.
Check the starting point: Sine functions start at zero, cosine functions start at their maximum or minimum.
Compare the graph to the given equations and match based on these properties.
Try solving on your own before revealing the answer!
Final Answer:
The equation represented is , based on the amplitude and period.
The graph starts at its maximum, indicating a cosine function.
