



Ch. 3 - Probability
Larson - Elementary Statistics: Picturing the World 8th Edition
Larson8th EditionElementary Statistics: Picturing the WorldISBN: 9780137493470Not the one you use?Change textbook
Chapter 3, Problem 3.3.20a

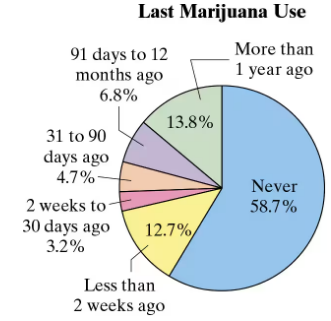
Marijuana Use The percent distribution of the last marijuana use (either medical or nonmedical) for a sample of 13,373 college students is shown in the pie chart. Find the
probability of each event. (Source: American College Health Association)
a. Randomly selecting a student who never used marijuana

Verified step by step guidance
1
Step 1: Understand the problem. The goal is to find the probability of randomly selecting a student who has never used marijuana. The pie chart provides the percent distribution of marijuana use among college students.
Step 2: Identify the relevant data from the pie chart. The section labeled 'Never' corresponds to students who have never used marijuana, and its percentage is 58.7%.
Step 3: Recall that probability is calculated as the proportion of the desired outcome relative to the total population. In this case, the probability of selecting a student who has never used marijuana is equal to the percentage of students in the 'Never' category divided by 100.
Step 4: Convert the percentage into a decimal form for probability calculation. To do this, divide 58.7 by 100. This gives the probability in decimal form.
Step 5: Interpret the result. The probability represents the likelihood of randomly selecting a student who has never used marijuana from the sample of 13,373 college students.

Verified video answer for a similar problem:

This video solution was recommended by our tutors as helpful for the problem above.
Video duration:
1m
Was this helpful?

Key Concepts

Here are the essential concepts you must grasp in order to answer the question correctly.

Probability

Probability is a measure of the likelihood that a particular event will occur, expressed as a number between 0 and 1. In this context, it refers to the chance of randomly selecting a student from the sample who has never used marijuana. The probability can be calculated by dividing the number of students in a specific category by the total number of students surveyed.
Recommended video:
5:37
Introduction to Probability

Percent Distribution

Percent distribution is a way of representing data in terms of percentages, showing how a total is divided among different categories. In the pie chart provided, each segment represents the percentage of students based on their last marijuana use, allowing for a visual comparison of the different categories, including those who have never used marijuana.
Recommended video:
Guided course
06:38
Intro to Frequency Distributions

Sample Size

Sample size refers to the number of observations or data points collected in a study. In this case, the sample size is 13,373 college students, which is significant for ensuring that the results are reliable and can be generalized to a larger population. A larger sample size typically leads to more accurate estimates of probabilities and distributions.
Recommended video:
05:11
Sampling Distribution of Sample Proportion
Related Practice
Textbook Question

"39. Reliability of Testing A virus infects one in every 200 people. A test used to detect the virus in a person is positive 80% of the time when the person has the virus and 5% of the time when the person does not have the virus. (This 5% result is called a false positive.) Let A be the event ""the person is infected"" and B be the event ""the person tests positive.""

a. Using Bayes' Theorem, when a person tests positive, determine the probability that the person is infected."

106
views
Textbook Question

87. College Football A stem-and-leaf plot for the numbers of touchdowns allowed by the 127 NCAA Division I Football Bowl Subdivision teams in the 2020-2021 season is shown. Find the probability that a team chosen at random allowed (a) at least 51 touchdowns. Are any of these events unusual? Explain. (Source: National Collegiate Athletic Association)

" style="" width="610">

80
views
Textbook Question

2. Determine whether each number could represent the probability of an event. Explain your reasoning. a. 25/25

103
views
Textbook Question

U.S. Age Distribution The projected percent distribution of the U.S. population for 2025 is shown in the pie chart. Find the probability of each event. (Source: U.S. Census

Bureau)

a. Randomly selecting someone who is under 10 years old

235
views
Textbook Question

Using the Multiplication Rule In Exercises 19-32, use the Multiplication Rule.

23. Celebrities as Role Models In a sample of 1103 probable voters, three out of four say they would like entertainers to address social and political issues. Two probable voters are selected at random. (Source: The Hollywood Reporter)

a. Find the probability that both probable voters would like entertainers to address social and political issues.

126
views
Textbook Question

Using the Multiplication Rule In Exercises 19-32, use the Multiplication Rule.

25. Best President In a sample of 1500 adult U.S. citizens, 270 said that Barack Obama was the best president in U.S. history. Two adult U.S. citizens are selected at random.

(Adapted from YouGov)

a. Find the probability that both adult U.S. citizens say that Barack Obama was the best president in U.S. history.

92
views