Skip to main content
Analytical Chemistry
My Course
Learn
Exam Prep
AI Tutor
Study Guides
Flashcards
Explore
Try the app
My Course
Learn
Exam Prep
AI Tutor
Study Guides
Flashcards
Explore
Try the app
Back
Titrations and Titration Curves quiz
You can tap to flip the card.
What does a redox titration curve track during a titration?
You can tap to flip the card.
👆
What does a redox titration curve track during a titration?
It tracks the change in concentration of either the analyte or the titrant as a function of the titrant's volume added.
Track progress
Control buttons has been changed to "navigation" mode.
1/15
Related flashcards
Related practice
Recommended videos
Titrations and Titration Curves definitions
Titrations and Titration Curves
15 Terms
Titrations and Titration Curves
15. Redox Titrations
5 problems
Topic
The End Point
15. Redox Titrations
5 problems
Topic
15. Redox Titrations
4 topics
12 problems
Chapter
Guided course
04:01
Redox Titration Curves
649
views
3
rank
Guided course
02:44
Redox Titration Curves
426
views
2
rank
2
comments
Guided course
04:39
Redox Titration Curves
361
views
1
comments
Terms in this set (15)
Hide definitions
What does a redox titration curve track during a titration?
It tracks the change in concentration of either the analyte or the titrant as a function of the titrant's volume added.
How do you calculate the equivalence volume in a titration?
Use the formula: molarity of analyte × volume of analyte = molarity of titrant × equivalence volume of titrant.
What is the significance of the equivalence point in a titration?
It is the point where equal moles of analyte and titrant have reacted, often indicated by a sharp change in the titration curve.
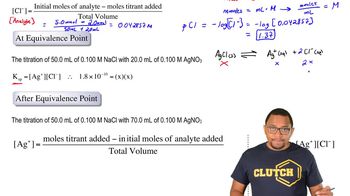
How do you calculate the concentration of unreacted analyte before the equivalence point?
Subtract the moles of titrant added from the initial moles of analyte, then divide by the total volume.
What does Ksp represent in a precipitation reaction during titration?
Ksp is the solubility product constant, representing the equilibrium between a solid ionic compound and its dissolved ions.
How is the formation constant (K) related to Ksp when the reaction is reversed?
The formation constant K is the inverse of Ksp (K = 1/Ksp) when the reaction is written in reverse.
At the equivalence point, how do you determine the concentration of ions in the precipitate?
Set up the Ksp expression with the ion concentrations as variables (x), then solve for x.
What does 'pCl' represent in the context of titration curves?
pCl is the negative logarithm (base 10) of the chloride ion concentration, similar to pH for hydrogen ions.
How does the titration curve behave as you approach and pass the equivalence point?
The curve shows a gradual increase in pCl, a sharp rise at the equivalence point, and then levels off as more titrant is added.
What calculation is performed after the equivalence point to find analyte concentration?
Calculate the excess titrant concentration, then use Ksp to solve for the analyte concentration.
Why is it important to know if you are before, at, or after the equivalence point during calculations?
Because the equations and approach for calculating concentrations differ depending on your position relative to the equivalence point.
What is the role of a visual indicator in a titration?
A visual indicator changes color near the endpoint, helping to approximate when the reaction is complete.
How can potentiometric titrations help in determining the endpoint?
They use electrodes to measure changes in potential, providing a more precise determination of the endpoint.
What is the relationship between the endpoint and the equivalence point in titrations?
The endpoint is where the indicator changes color, which may not exactly match the theoretical equivalence point.
How can titration data be used to identify an unknown analyte in the lab?
By analyzing the titration curve and equivalence volume, you can calculate the concentration and possibly the identity of the unknown analyte.
 BackBack
 04:01
04:01