
Domanda del libro di testo
Area of roses Assume m is a positive integer.
a. Even number of leaves: What is the relationship between the total area enclosed by the 4m-leaf rose r=cos(2mθ) and m?
26
views

 Guida verificata passo dopo passo
 08:02
08:02
 06:37
06:37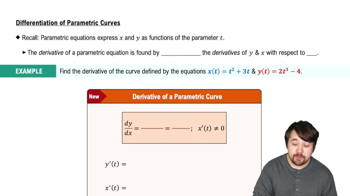 06:49
06:49Area of roses Assume m is a positive integer.
a. Even number of leaves: What is the relationship between the total area enclosed by the 4m-leaf rose r=cos(2mθ) and m?
Reflection property of parabolas: Consider the parabola y = x²/(4p) with its focus at F(0, p). The goal is to show that the angle of incidence (α) equals the angle of reflection (β).
a. Let P(x₀, y₀) be a point on the parabola. Show that the slope of the tangent line at P is tan θ = x₀/(2p).
Explain why or why not Determine whether the following statements are true and give an explanation or counterexample.
a. The point with Cartesian coordinates (−2, 2) has polar coordinates (2√2, 3π/4), (2√2, 11π/4), (2√2, −5π/4), and (−2√2,−π/4).
67–72. Derivatives Consider the following parametric curves.
a. Determine dy/dx in terms of t and evaluate it at the given value of t.
x = cos t, y = 8 sin t; t = π/2
67–72. Derivatives Consider the following parametric curves.
a. Determine dy/dx in terms of t and evaluate it at the given value of t.
x = t + 1/t, y = t − 1/t; t = 1
(Use of Tech) Finger curves: r = f(θ) = cos(aᶿ) - 1.5, where a = (1 + 12π)^(1/(2π)) ≈ 1.78933
a. Show that f(0) = f(2π) and find the point on the curve that corresponds to θ = 0 and θ = 2π.