Ch.4 - Reactions in Aqueous Solution
Brown - Chemistry: The Central Science 14th Edition
Brown14th EditionChemistry: The Central ScienceISBN: 9780134414232당신이 사용하는 게 아니라요?교과서 변경
4장, 문제 11

Which data set, of the two graphed here, would you expect to observe from a titration like that shown in Figure 4.18?

검증된 단계별 안내
1
Step 1: Understand the concept of titration. Titration is a technique used in chemistry to measure the concentration of an unknown solution (the analyte) by adding a solution of known concentration (the titrant) until the reaction between the two is complete. This point is called the equivalence point.
Step 2: Look at Figure 4.18. This figure should show a titration curve, which is a graph of the pH of the solution as a function of the volume of titrant added. The curve typically has a sigmoidal shape, with a steep increase in pH near the equivalence point.
Step 3: Compare the two data sets with the typical titration curve. The data set that most closely resembles the sigmoidal shape of a typical titration curve is the one you would expect to observe from a titration like that shown in Figure 4.18.
Step 4: Identify the equivalence point in the data set. The equivalence point is where the pH changes most rapidly, corresponding to the steepest part of the curve. This is where the amount of titrant added is just enough to completely react with the analyte.
Step 5: Confirm your choice. The data set that shows a steep change in pH at the equivalence point and a sigmoidal shape overall is the one you would expect from a titration like that shown in Figure 4.18.

비슷한 문제에 대한 검증된 영상 답변:

이 영상 해법은 위 문제에 도움이 된다고 튜터들이 추천한 것입니다.
영상 길이:
3m
도움이 되었나요?

주요 개념

질문에 올바르게 답하기 위해 반드시 이해해야 하는 핵심 개념들은 다음과 같습니다.

Titration

Titration is a quantitative analytical technique used to determine the concentration of a solute in a solution. It involves the gradual addition of a titrant to a solution of analyte until the reaction reaches its endpoint, which is often indicated by a color change. Understanding the titration process is essential for interpreting the data sets, as it provides context for the expected results.
추천 영상:
가이드 코스
03:04
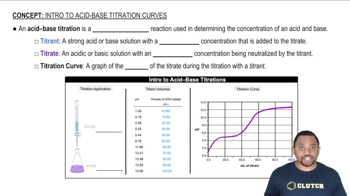
Acid-Base Titration

Graph Interpretation

Graph interpretation involves analyzing graphical data to extract meaningful information. In the context of titration, graphs typically plot the volume of titrant added against the pH of the solution. Recognizing the shape of the titration curve, such as the steep rise at the equivalence point, is crucial for predicting which data set corresponds to the titration process depicted in the question.
추천 영상:
가이드 코스
03:13
Intepreting the Band of Stability

Equivalence Point

The equivalence point in a titration is the stage at which the amount of titrant added is stoichiometrically equivalent to the amount of substance in the analyte solution. This point is critical for determining the concentration of the unknown solution. Identifying the equivalence point on a graph helps in selecting the correct data set, as it typically corresponds to a significant change in pH or another measurable property.
추천 영상:
가이드 코스
01:07
At the Equivalence Point