Ch. 2 - Transmission Genetics
Sanders - Genetic Analysis: An Integrated Approach 3rd Edition
Sanders3rd EditionGenetic Analysis: An Integrated ApproachISBN: 9780135564172당신이 사용하는 게 아니라요?교과서 변경
2장, 문제 30d

Dr. Ara B. Dopsis and Dr. C. Ellie Gans are performing genetic crosses on daisy plants. They self-fertilize a blue-flowered daisy and grow 100 progeny plants that consist of 55 blue-flowered plants, 22 purple-flowered plants, and 23 white-flowered plants. Dr. Dopsis believes this is the result of segregation of two alleles at one locus and that the progeny ratio is 1:2:1. Dr. Gans thinks the progeny phenotypes are the result of two epistatic genes and that the ratio is 9:3:4.
The two scientists ask you to resolve their conflict by performing chi-square analysis on the data for both proposed genetic mechanisms. For each proposed mechanism, fill in the values requested on the form the researchers have provided for your analysis.


Using any of the 100 progeny plants, propose a cross that will verify the conclusion you proposed in part (c). Plants may be self-fertilized, or one plant can be crossed to another. What result will be consistent with the 1:2:1 hypothesis? What result will be consistent with the 9:3:4 hypothesis?

검증된 단계별 안내
1
Step 1: Understand the problem. The goal is to determine which hypothesis (1:2:1 or 9:3:4) best explains the observed data using chi-square analysis. The observed data consists of 55 blue-flowered plants, 22 purple-flowered plants, and 23 white-flowered plants. The expected ratios for the two hypotheses are 1:2:1 and 9:3:4, respectively.
Step 2: Calculate the expected numbers for each phenotype under both hypotheses. For the 1:2:1 hypothesis, divide the total number of progeny (100) into the expected ratio (1:2:1). For the 9:3:4 hypothesis, divide the total number of progeny (100) into the expected ratio (9:3:4). Use the formula: \( \text{Expected number} = \text{Total progeny} \times \frac{\text{Ratio for phenotype}}{\text{Sum of all ratios}} \).
Step 3: Perform chi-square analysis for each hypothesis. Use the formula: \( \chi^2 = \sum \frac{(O - E)^2}{E} \), where \( O \) is the observed number and \( E \) is the expected number for each phenotype. Calculate \( \chi^2 \) for the 1:2:1 hypothesis and the 9:3:4 hypothesis separately.
Step 4: Compare the calculated \( \chi^2 \) values to the critical value from a chi-square distribution table. Determine the degrees of freedom (\( df \)) using the formula: \( df = \text{Number of phenotypic categories} - 1 \). If the \( \chi^2 \) value is less than the critical value, the hypothesis is supported; otherwise, it is rejected.
Step 5: Propose a test cross to verify the conclusion. For the 1:2:1 hypothesis, self-fertilize a heterozygous plant (e.g., Aa) and expect a 1:2:1 ratio in the progeny. For the 9:3:4 hypothesis, cross a dihybrid plant (e.g., AaBb) with a homozygous recessive plant (aabb) and expect a 1:1:2 ratio in the progeny. Compare the observed results to the expected ratios to confirm the hypothesis.

비슷한 문제에 대한 검증된 영상 답변:

이 영상 해법은 위 문제에 도움이 된다고 튜터들이 추천한 것입니다.
영상 길이:
1m
도움이 되었나요?

주요 개념

질문에 올바르게 답하기 위해 반드시 이해해야 하는 핵심 개념들은 다음과 같습니다.

Mendelian Genetics

Mendelian genetics is the study of how traits are inherited through the segregation and independent assortment of alleles. Gregor Mendel's principles, particularly the law of segregation, explain how alleles for a trait separate during gamete formation, leading to predictable ratios in offspring. In this case, the 1:2:1 ratio proposed by Dr. Dopsis suggests a single gene with two alleles, where homozygous individuals produce one type of gamete, while heterozygous individuals produce two types.
추천 영상:
가이드 코스
03:45
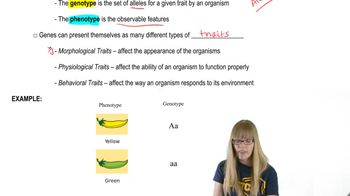
Descriptive Genetics

Epistasis

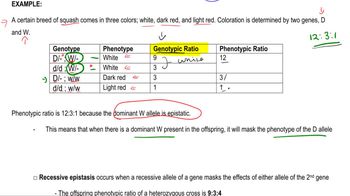
Epistasis refers to the interaction between genes, where the expression of one gene can mask or modify the expression of another gene. This phenomenon can lead to non-Mendelian ratios in offspring. Dr. Gans's hypothesis of a 9:3:4 ratio indicates that two genes are involved, with one gene's alleles affecting the phenotypic expression of another, resulting in a modified phenotypic ratio that deviates from simple Mendelian inheritance.
추천 영상:
가이드 코스
13:08
Epistatic Genes

Chi-Square Analysis

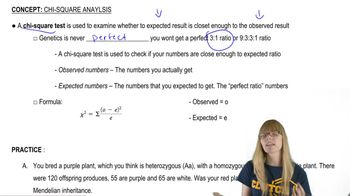
Chi-square analysis is a statistical method used to determine if there is a significant difference between observed and expected frequencies in categorical data. In genetics, it helps assess whether the observed ratios of phenotypes in progeny fit the expected ratios based on a specific genetic hypothesis. By calculating the chi-square value and comparing it to a critical value from the chi-square distribution, researchers can evaluate the validity of the proposed genetic mechanisms.
추천 영상:
가이드 코스
02:48
Chi Square Analysis