 Back
BackCh 5 Microbial Metabolism: Structured Study Notes
Study Guide - Smart Notes
 Tailored notes based on your materials, expanded with key definitions, examples, and context.
Microbial Metabolism
Overview of Metabolism
Metabolism encompasses all controlled biochemical reactions within a microbe, serving the ultimate function of reproducing the organism. It is divided into two major classes: catabolism and anabolism, which are interconnected through energy transfer and precursor molecules.
Catabolism: Breakdown of larger molecules into smaller products; exergonic (releases energy).
Anabolism: Synthesis of large molecules from smaller products; endergonic (requires energy).
ATP: Central molecule for energy storage and transfer.
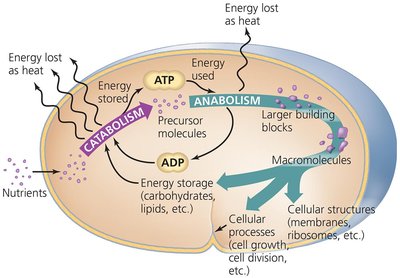
Additional info: Catabolic reactions provide energy and precursor metabolites for anabolic processes, which build cellular structures and macromolecules.
Catabolism and Anabolism
Catabolic and anabolic pathways are fundamental to cellular metabolism. Catabolic pathways release energy by breaking down complex molecules, while anabolic pathways consume energy to build complex molecules from simpler ones.
Catabolic Pathways: Exergonic, produce ATP and precursor metabolites.
Anabolic Pathways: Endergonic, use ATP and precursor metabolites to synthesize macromolecules.
Oxidation and Reduction Reactions
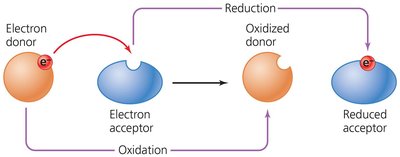
Oxidation-reduction (redox) reactions involve the transfer of electrons from an electron donor to an electron acceptor. These reactions are essential for energy production in cells and always occur simultaneously.
Oxidation: Loss of electrons.
Reduction: Gain of electrons.
Electron Carriers: NAD+, NADP+, FAD.
ATP Production and Energy Storage
Cells produce ATP by phosphorylating ADP through three mechanisms: substrate-level phosphorylation, oxidative phosphorylation, and photophosphorylation. ATP is then used to drive anabolic reactions.
Substrate-level phosphorylation: Direct transfer of phosphate to ADP.
Oxidative phosphorylation: Uses energy from electron transport chain.
Photophosphorylation: Uses light energy in photosynthetic organisms.
Enzymes in Metabolism
Enzyme Classification and Function
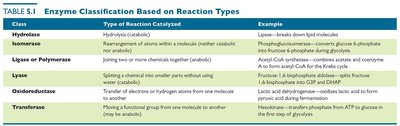
Enzymes are organic catalysts that increase the likelihood of biochemical reactions. They are classified based on their mode of action.
Class | Type of Reaction Catalyzed | Example |
|---|---|---|
Hydrolase | Hydrolysis (catabolic) | Lipase—breaks down lipid molecules |
Isomerase | Rearrangement of atoms within a molecule | Phosphoglucoisomerase—converts glucose-6-phosphate to fructose-6-phosphate during glycolysis |
Ligase/Polymerase | Joining two or more chemicals together (anabolic) | Acetyl-CoA synthetase—combines acetate and coenzyme A to form acetyl-CoA for the Krebs cycle |
Lyase | Splitting a chemical into smaller parts without using water | Fructose-1,6-bisphosphate aldolase—splits fructose-1,6-bisphosphate into G3P and DHAP during glycolysis |
Oxidoreductase | Transfer of electrons or hydrogen atoms from one molecule to another | Lactic acid dehydrogenase—converts pyruvic acid to lactic acid during fermentation |
Transferase | Moving a functional group from one molecule to another | Hexokinase—transfers phosphate from ATP to glucose in the first step of glycolysis |
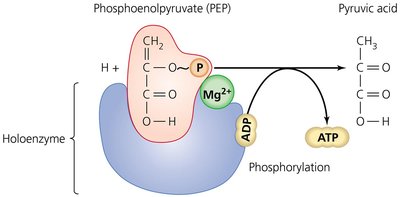
Enzyme Structure: Holoenzyme Components
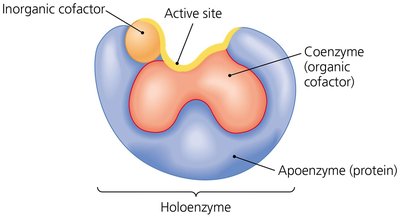
Enzymes may require cofactors for activity. The combination of an apoenzyme (protein) and its cofactors forms a holoenzyme. Cofactors can be inorganic ions or organic coenzymes.
Apoenzyme: Protein portion, inactive without cofactors.
Cofactor: Nonprotein component (inorganic or organic).
Coenzyme: Organic cofactor, often derived from vitamins.
Holoenzyme: Active enzyme with all necessary cofactors.
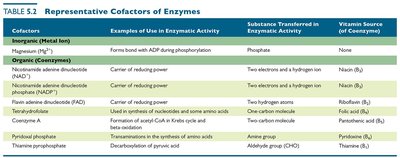
Representative Cofactors of Enzymes
Cofactors are essential for enzyme function, facilitating various biochemical transformations. They may be metal ions or organic molecules (coenzymes).
Cofactor | Example of Use | Substance Transferred | Vitamin Source |
|---|---|---|---|
Mg2+ | Forms bond with ADP during phosphorylation | Phosphate | None |
NAD+ | Carrier of reducing power | Two electrons and a hydrogen ion | Niacin (B3) |
NADP+ | Carrier of reducing power | Two electrons and a hydrogen ion | Niacin (B3) |
FAD | Carrier of reducing power | Two hydrogen atoms | Riboflavin (B2) |
Tetrahydrofolate | Used in synthesis of nucleotides and some amino acids | One carbon molecule | Folic acid (B9) |
Coenzyme A | Formation of acetyl-CoA in Krebs cycle | Acetyl group | Pantothenic acid (B5) |
Pyridoxal phosphate | Transamination in the synthesis of amino acids | Amino group (–NH2) | Pyridoxine (B6) |
Thiamine pyrophosphate | Decarboxylation of pyruvic acid | Aldehyde group (–CHO) | Thiamine (B1) |
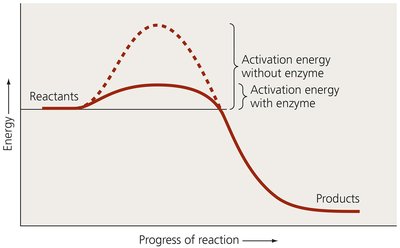
Activation Energy and Enzyme Activity
Enzymes lower the activation energy required for chemical reactions, thereby increasing the rate of reaction. The active site of an enzyme binds to the substrate, facilitating the transformation.
Activation Energy: Minimum energy required to initiate a reaction.
Active Site: Region of enzyme where substrate binds.
Substrate: Molecule upon which an enzyme acts.
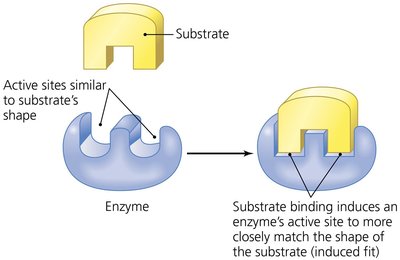
Enzyme-Substrate Interaction
Enzymes exhibit specificity for their substrates, often described by the induced fit model. Substrate binding induces a conformational change in the enzyme's active site.
Induced Fit Model: Active site changes shape to fit substrate.
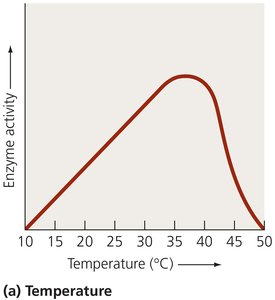
Factors Affecting Enzyme Activity
Enzyme activity is influenced by temperature, pH, substrate concentration, and the presence of inhibitors. Each factor can alter the rate and efficiency of enzymatic reactions.
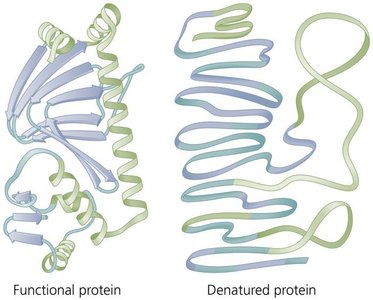
Temperature: Optimal range enhances activity; extremes cause denaturation.
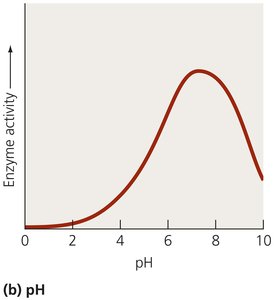
pH: Each enzyme has an optimal pH; deviations can denature proteins.
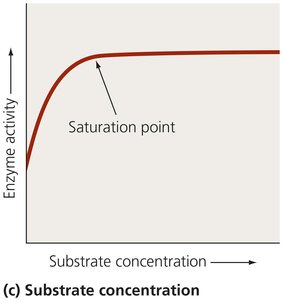
Substrate Concentration: Increased concentration raises activity until saturation is reached.
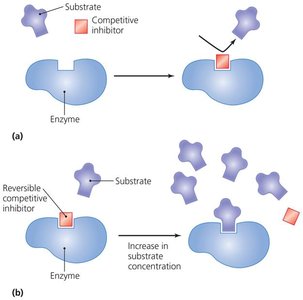
Inhibitors: Competitive and noncompetitive inhibitors reduce enzyme activity.
Control of Enzymatic Activity
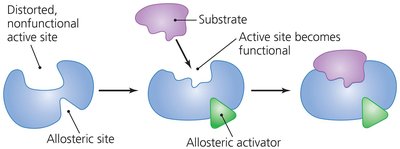
Enzyme activity can be regulated by activators and inhibitors. Allosteric activation and inhibition are key mechanisms, as is feedback inhibition, which controls metabolic pathways.
Allosteric Activation: Activator binds to allosteric site, enabling active site function.
Competitive Inhibition: Inhibitor competes with substrate for active site.
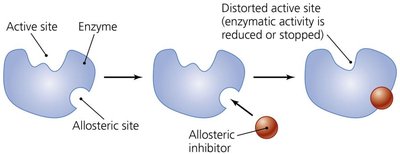
Noncompetitive Inhibition: Inhibitor binds to allosteric site, distorting active site.
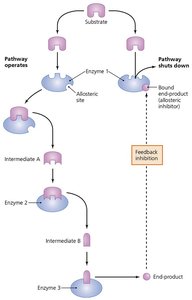
Feedback Inhibition: End-product inhibits pathway, preventing overproduction.
Carbohydrate Catabolism
Glucose Catabolism: Respiration and Fermentation
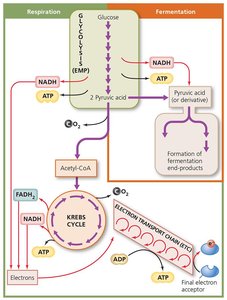
Glucose is the primary carbohydrate used by most organisms for energy. It is catabolized by cellular respiration or fermentation, depending on the availability of oxygen.
Cellular Respiration: Complete oxidation of glucose to CO2 and H2O, producing ATP.
Fermentation: Partial oxidation of glucose, producing less ATP and various end-products.
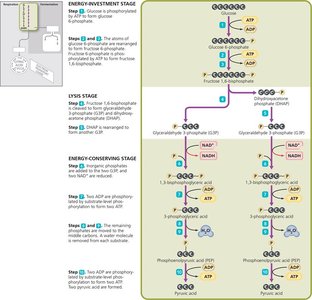
Glycolysis
Glycolysis occurs in the cytoplasm and splits glucose into two molecules of pyruvic acid. It consists of three stages: energy-investment, lysis, and energy-conserving.
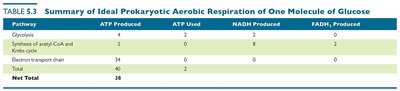
Net Gain: 2 ATP, 2 NADH, and 2 pyruvic acid per glucose.
Substrate-level phosphorylation: Direct transfer of phosphate to ADP.
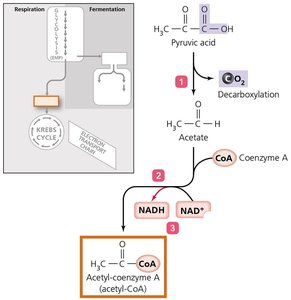
Cellular Respiration: Synthesis of Acetyl-CoA
Pyruvic acid is converted to acetyl-CoA, which enters the Krebs cycle. This process produces NADH and CO2.
Products: 2 acetyl-CoA, 2 NADH, 2 CO2 per glucose.
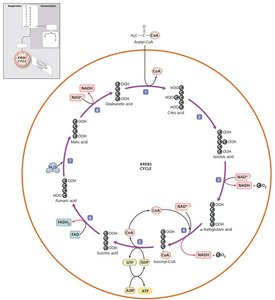
Krebs Cycle
The Krebs cycle occurs in the cytosol of prokaryotes and mitochondrial matrix of eukaryotes. It transfers energy to NAD+ and FAD, producing ATP, NADH, FADH2, and CO2.
Products: 2 ATP, 2 FADH2, 6 NADH, 4 CO2 per glucose.
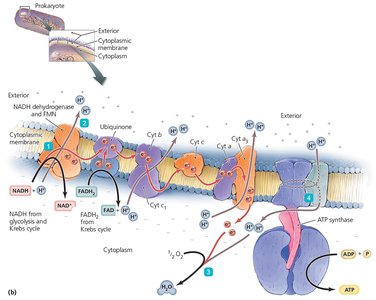
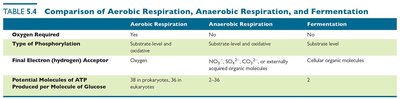
Electron Transport Chain (ETC) and Chemiosmosis
The ETC is a series of carrier molecules that transfer electrons to a final electron acceptor, generating a proton gradient used for ATP synthesis via chemiosmosis.
Aerobic Respiration: Oxygen is the final electron acceptor.
Anaerobic Respiration: Other molecules (e.g., NO3-, SO42-) serve as acceptors.
ATP Yield: Up to 34 ATP per glucose via oxidative phosphorylation.


Metabolic Diversity: Alternative Pathways
Bacteria may use alternative pathways for glucose catabolism, such as the Entner-Doudoroff and pentose phosphate pathways. These pathways produce different amounts of ATP and precursor metabolites.
Entner-Doudoroff Pathway: Found only in prokaryotes; produces 1 ATP, 1 NADH, 1 NADPH.
Pentose Phosphate Pathway: Produces NADPH and precursor metabolites for biosynthesis.
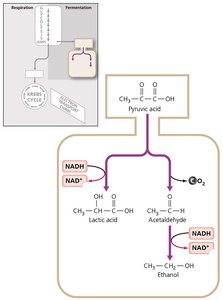
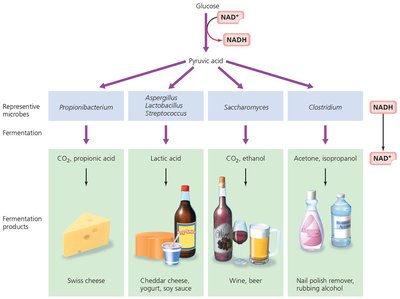
Fermentation
Fermentation provides cells with an alternative source of NAD+ when oxygen is unavailable. It results in the production of various end-products, which can be used to identify bacteria.
End-products: Lactic acid, ethanol, propionic acid, acetone, etc.
Biochemical Tests: Used to identify bacteria based on fermentation products.

Other Catabolic Pathways
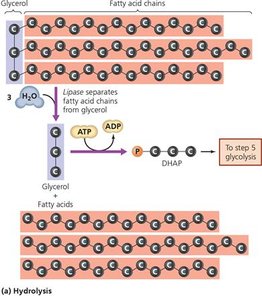
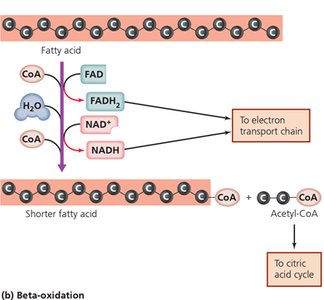
Lipid Catabolism
Lipids are hydrolyzed into glycerol and fatty acids. Glycerol enters glycolysis, while fatty acids undergo beta-oxidation to produce acetyl-CoA, NADH, and FADH2.
Hydrolysis: Lipase separates fatty acids from glycerol.
Beta-oxidation: Sequential removal of two-carbon units from fatty acids.
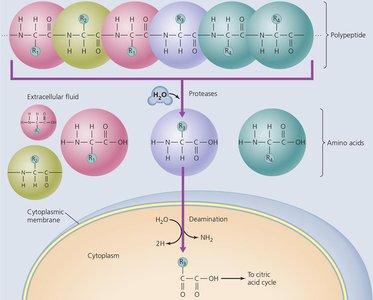
Protein Catabolism
Proteins are broken down into amino acids, which are deaminated to remove the amino group. The resulting carbon skeletons enter the citric acid cycle for energy production.
Deamination: Removal of amino group, producing ammonia and other nitrogenous wastes.
Photosynthesis
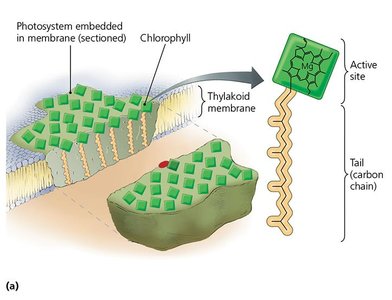
Photosynthetic Structures and Reactions
Photosynthetic organisms capture light energy using chlorophyll and photosystems embedded in thylakoid membranes. Photosynthesis consists of light-dependent and light-independent reactions.
Light-dependent reactions: Use light energy to produce ATP and NADPH.
Light-independent reactions: Use ATP and NADPH to fix CO2 into glucose (Calvin-Benson cycle).
Integration and Regulation of Metabolic Function
Regulation of Metabolic Pathways
Cells regulate metabolism by controlling enzyme synthesis and activity. Feedback inhibition, compartmentalization, and gene expression are key regulatory mechanisms.
Feedback Inhibition: Prevents overproduction of end-products.
Compartmentalization: Eukaryotes isolate pathways in organelles.
Gene Expression: Controls timing and amount of enzyme production.
Metabolic Expression: Controls activity of enzymes once produced.
Additional info: Regulation ensures efficient use of resources and prevents wasteful overproduction of metabolites.
