 Back
BackAnalyzing Reaction Stability and Spontaneity Using Energy Diagrams
Study Guide - Smart Notes
 Tailored notes based on your materials, expanded with key definitions, examples, and context.
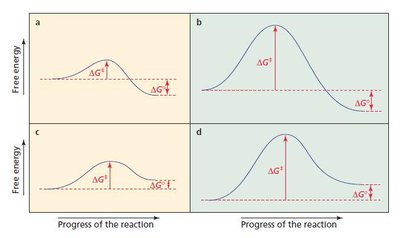
Q3. Analyze the following reactions based on their energy diagrams:
Background
Topic: Reaction Thermodynamics and Kinetics
This question is testing your understanding of the concepts of kinetic and thermodynamic stability, spontaneity, and the effect of temperature on reaction feasibility. The diagrams provided show the free energy changes () and activation energies () for different reactions.
Key Terms and Formulas
Activation Energy (): The energy barrier that must be overcome for a reaction to proceed. Lower means the reaction is faster (more kinetically stable).
Free Energy Change (): The difference in free energy between reactants and products. Negative means the reaction is thermodynamically favorable (spontaneous).
Kinetic Stability: Determined by the size of the activation energy. High means the reaction is slow (kinetically stable).
Thermodynamic Stability: Determined by the sign and magnitude of . Negative $\Delta G$ means the products are more stable than the reactants.
Step-by-Step Guidance
Examine each energy diagram (a, b, c, d) and identify the values of (activation energy) and (overall free energy change) for each reaction.
Recall that a lower means the reaction is more likely to occur quickly (less kinetically stable), while a higher $\Delta G^\ddagger$ means the reaction is slower (more kinetically stable).
Recall that a negative means the reaction is thermodynamically favorable (spontaneous), while a positive $\Delta G$ means it is not spontaneous under standard conditions.
For each diagram, match the following properties to the correct reaction: most kinetically stable, thermodynamically and kinetically unstable, thermodynamically stable and kinetically unstable, thermodynamically and kinetically stable, spontaneous, not spontaneous, can occur at low temperatures, can only occur at high temperatures.
Use the relationships between , , and temperature to justify your assignments. For example, a reaction with a high $\Delta G^\ddagger$ and negative $\Delta G$ is thermodynamically stable but kinetically unstable.
Try solving on your own before revealing the answer!
Final Answer:
Each diagram corresponds to a different combination of kinetic and thermodynamic properties. For example, diagram (a) shows low activation energy and negative , indicating a reaction that is both kinetically and thermodynamically favorable (spontaneous and fast). Diagram (b) shows high activation energy and negative $\Delta G$, indicating thermodynamic stability but kinetic instability (slow but favorable). Diagram (c) shows low activation energy and positive $\Delta G$, indicating kinetic favorability but thermodynamic instability (fast but not spontaneous). Diagram (d) shows high activation energy and positive $\Delta G$, indicating both kinetic and thermodynamic instability (slow and not spontaneous).
Use these observations to match each property to the correct diagram.
