 Back
BackInfrared (IR) Spectroscopy in Organic Chemistry: Principles and Applications
Study Guide - Smart Notes
 Tailored notes based on your materials, expanded with key definitions, examples, and context.
Infrared (IR) Spectroscopy: Principles and Applications
Electromagnetic Radiation and the Electromagnetic Spectrum
Electromagnetic radiation is radiant energy exhibiting both wave and particle properties. Photons are the particles of electromagnetic radiation, each carrying a quantum of energy. The electromagnetic spectrum encompasses a range of wavelengths and frequencies, from gamma rays to radio waves, with visible light occupying only a small portion.
Wavelength (\(\lambda\)): The distance between two identical points on adjacent waves.
Frequency (\(\nu\)): The number of waves passing a point per unit time, measured in hertz (Hz).
Energy (E): Directly proportional to frequency, given by \(E = h\nu\), where \(h\) is Planck’s constant.
Energy and wavelength are inversely proportional: \(E = \frac{hc}{\lambda}\).
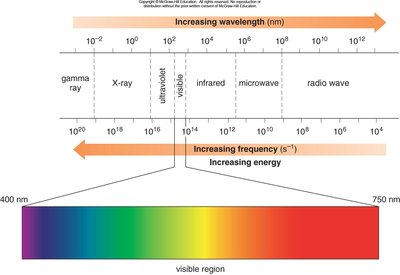
Additional info: The IR region is particularly important for organic spectroscopy, as it interacts with molecular vibrations.
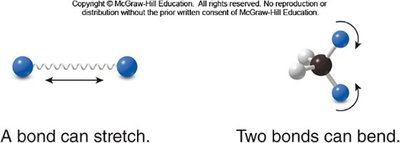
Vibrational Modes and IR Absorption
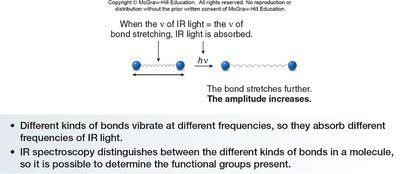
Absorption of IR light causes changes in the vibrational motions of molecules, including stretching and bending modes. These vibrational modes are quantized and occur only at specific frequencies corresponding to IR light.
Stretching: Change in bond length.
Bending: Change in bond angle.
When the frequency of IR light matches the frequency of a particular vibrational mode, IR light is absorbed, increasing the amplitude of the vibration.
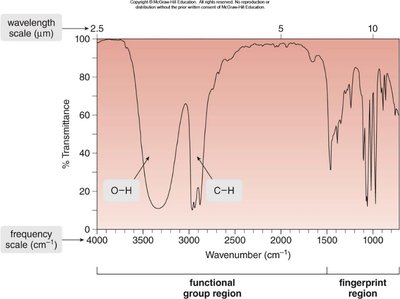
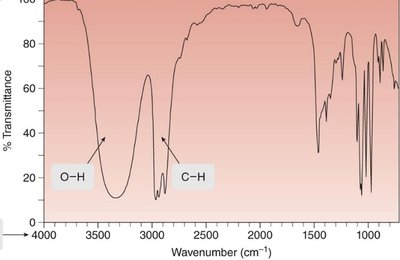
IR Spectrum: Structure and Interpretation
An IR spectrum is a plot of transmitted light versus wavenumber (\(\tilde{\nu}\)), typically ranging from 4000 cm-1 to 400 cm-1. The x-axis is reported in wavenumbers (cm-1), which are inversely proportional to wavelength. The y-axis is % transmittance, indicating how much light passes through the sample.
Each peak corresponds to a specific bond type.
IR spectroscopy is used to identify functional groups in organic compounds.

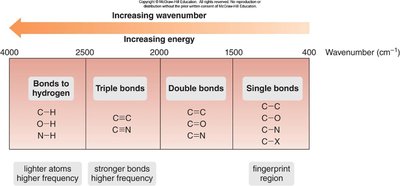
Regions of the IR Spectrum
The IR spectrum is divided into two main regions:
Functional Group Region: ≥1500 cm-1, where most functional group absorptions occur.
Fingerprint Region: <1500 cm-1, unique to each molecule and useful for identification.
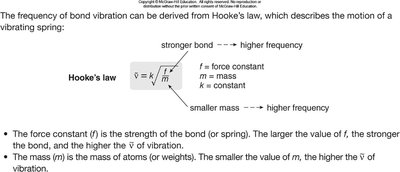
Bond Strength, Atom Mass, and IR Absorption
The position of IR absorption depends on bond strength and atom mass. Stronger bonds and lighter atoms vibrate at higher frequencies, absorbing at higher wavenumbers.
Bond strength: Triple > Double > Single
Atom mass: Lighter atoms vibrate at higher frequency
Bonds can be modeled as springs with weights, governed by Hooke’s Law:
Classification of IR Absorptions by Bond Type
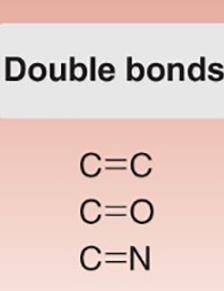
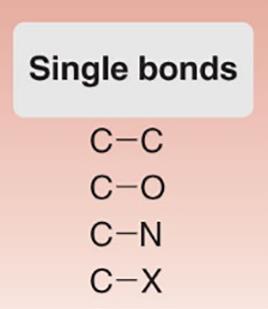
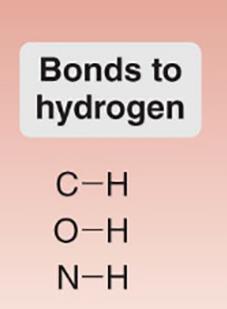
Different types of bonds absorb IR at characteristic wavenumbers. The four main regions are:
Bonds to Hydrogen: C–H, O–H, N–H
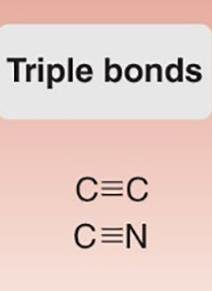
Triple Bonds: C≡C, C≡N
Double Bonds: C=C, C=O, C=N
Single Bonds: C–C, C–O, C–N, C–X
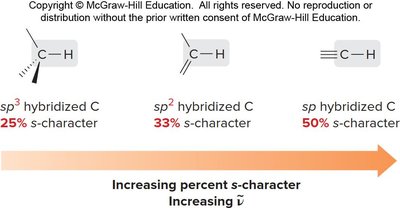
Bond Strength and s-Character
The percent s-character in hybridized carbon atoms affects bond strength and IR absorption frequency. Higher s-character results in stronger bonds and higher wavenumbers.
sp3 hybridized C: 25% s-character
sp2 hybridized C: 33% s-character
sp hybridized C: 50% s-character
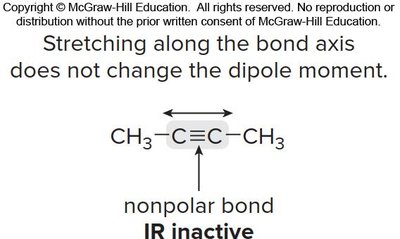
Symmetry and IR Activity
For a bond to absorb IR, there must be a change in dipole moment during vibration. Symmetrical nonpolar bonds are IR inactive.
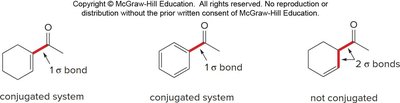
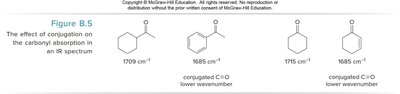
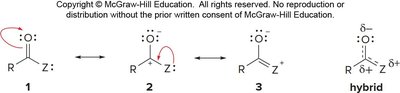
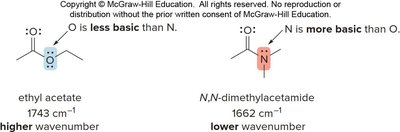
Resonance and Basicity Effects on IR Absorptions
Conjugation and basicity affect the frequency of IR absorptions, especially for carbonyl groups. Conjugation with C=C or benzene rings shifts absorption to lower wavenumbers (~30 cm-1 lower).
The basicity of substituents (Z) also affects carbonyl absorption: more basic Z increases electron donation, lowering the absorption frequency.
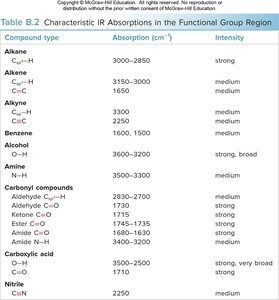
Summary Table: Important IR Absorptions
The following table summarizes key IR absorptions for common bond types:
Bond type | Approximate \(\tilde{\nu}\) (cm-1) | Intensity |
|---|---|---|
O—H | 3600–3200 | strong, broad |
N—H | 3500–3200 | medium |
C—H | ~3000 | medium |
Csp3—H | 3000–2850 | strong |
Csp2—H | 3150–3000 | medium |
Csp—H | 3300 | medium |
C≡C | 2250 | medium |
C≡N | 2250 | medium |
C=O | 1800–1650 (often ~1700) | strong |
C=C | 1650 | medium |
Benzene ring | 1600, 1500 | medium |
Characteristic IR Spectra of Organic Functional Groups
Each functional group in organic molecules has a characteristic IR absorption pattern:
Alkanes: Csp3—H at 3000–2850 cm-1
Alkenes: Csp2—H at 3150–3000 cm-1, C=C at 1650 cm-1
Alkynes: Csp—H at 3300 cm-1, C≡C at 2250 cm-1
Aromatic compounds: Benzene ring at 1600, 1500 cm-1
Alcohols: O—H at 3600–3200 cm-1
Ethers: C—H at ~3000 cm-1
Aldehydes: C=O at ~1700 cm-1, Csp2—H at 2830–2700 cm-1
Ketones: C=O at ~1700 cm-1
Carboxylic acids: C=O at ~1700 cm-1, O—H at 3500–3000 cm-1
Amides: N—H at 3200, 3400 cm-1, C=O at 1660 cm-1
Amines: N—H at 3300, 3400 cm-1
Nitriles: C≡N at ~2250 cm-1
See the following table for a summary:
Compound type | Absorption (cm-1) | Intensity |
|---|---|---|
Alkane (Csp3—H) | 3000–2850 | strong |
Alkene (Csp2—H, C=C) | 3150–3000, 1650 | medium |
Alkyne (Csp—H, C≡C) | 3300, 2250 | medium |
Benzene (Csp2—H, ring) | 3150–3000, 1600, 1500 | medium |
Alcohol (O—H) | 3600–3200 | strong, broad |
Amine (N—H) | 3500–3200 | medium |
Aldehyde (C=O, Csp2—H) | 2830–2700, 1715 | strong |
Ketone (C=O) | 1710 | strong |
Ester (C=O) | 1740 | strong |
Amide (C=O, N—H) | 1660–1630, 3500–3200 | strong |
Carboxylic acid (C=O, O—H) | 1710, 3500–2500 | strong, very broad |
Nitrile (C≡N) | 2250 | medium |
Examples of IR Spectra for Organic Compounds
Below are examples of IR spectra for various organic compounds, illustrating their characteristic absorptions:
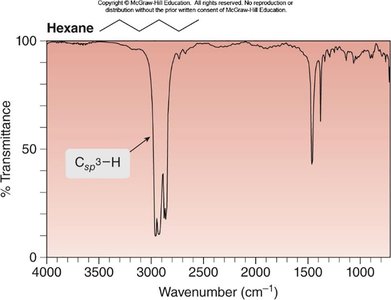
Hexane: Csp3—H absorption at 3000–2850 cm-1
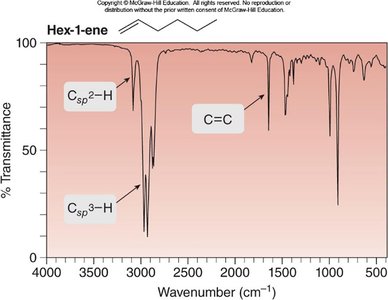
Hex-1-ene: Csp2—H at 3150–3000 cm-1, Csp3—H at 3000–2850 cm-1, C=C at 1650 cm-1
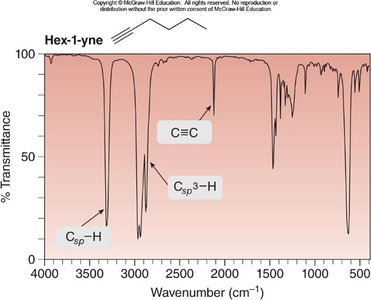
Hex-1-yne: Csp—H at 3300 cm-1, Csp3—H at 3000–2850 cm-1, C≡C at 2250 cm-1
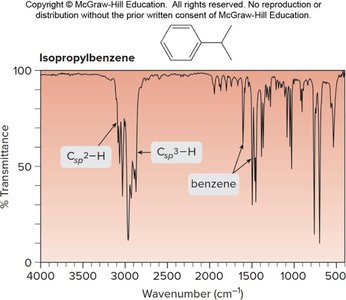
Isopropylbenzene: Csp2—H at 3150–3000 cm-1, Csp3—H at 3000–2850 cm-1, benzene ring at 1600, 1500 cm-1
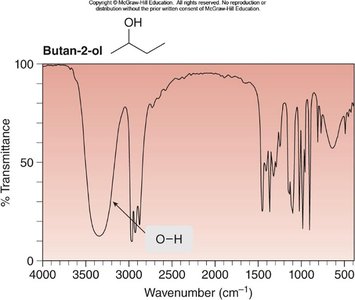
Butan-2-ol: O—H at 3600–3200 cm-1
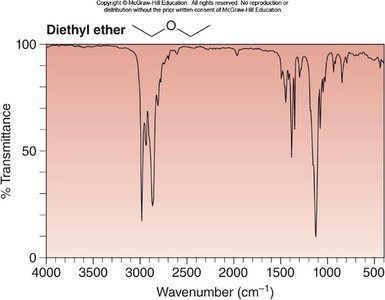
Diethyl ether: C—H at ~3000 cm-1
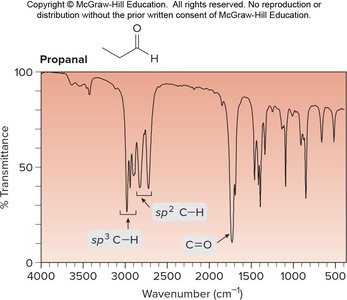
Propanal: C=O at ~1700 cm-1, Csp2—H at 2830–2700 cm-1
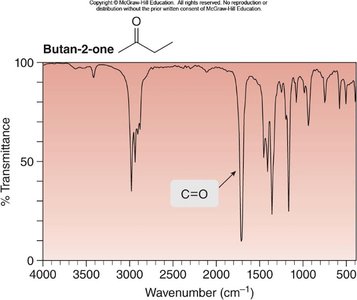
Butan-2-one: C=O at ~1700 cm-1
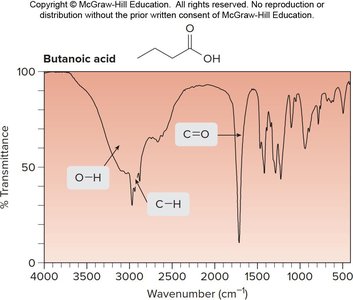
Butanoic acid: C=O at ~1700 cm-1, O—H at 3500–3000 cm-1
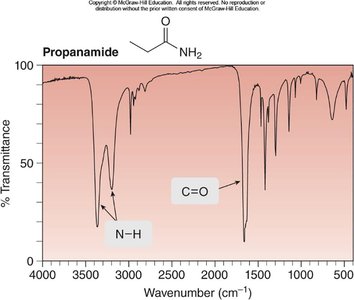
Propanamide: N—H at 3200, 3400 cm-1, C=O at 1660 cm-1
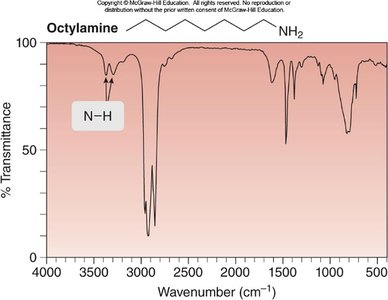
Octylamine: N—H at 3300, 3400 cm-1
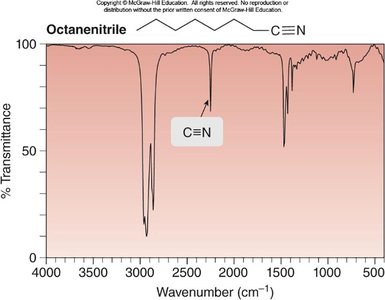
Octanenitrile: C≡N at ~2250 cm-1
Summary and Applications
IR spectroscopy is a powerful analytical technique for identifying functional groups and characterizing organic compounds. By analyzing the characteristic absorptions in the IR spectrum, chemists can deduce the presence of specific bonds and functional groups, aiding in structure determination and reaction outcome analysis.
