 Back
BackInfrared Spectroscopy and Electromagnetic Radiation in Organic Chemistry
Study Guide - Smart Notes
 Tailored notes based on your materials, expanded with key definitions, examples, and context.
Electromagnetic Radiation: Frequency, Wavelength, and Energy
Overview of the Electromagnetic Spectrum
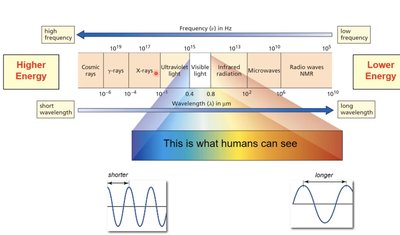
The electromagnetic spectrum encompasses all types of electromagnetic radiation, ranging from high-energy cosmic rays to low-energy radio waves. The visible region is a small portion that humans can see, but organic chemists often use ultraviolet, infrared, and radio frequencies for spectroscopic analysis.
High frequency radiation (e.g., X-rays, UV) has higher energy and shorter wavelength.
Low frequency radiation (e.g., radio waves) has lower energy and longer wavelength.
Relationship Between Frequency and Wavelength
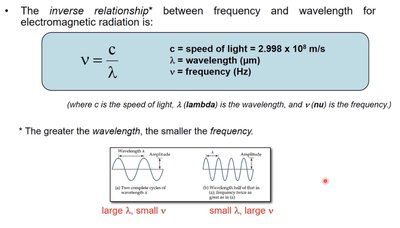
Frequency (ν) and wavelength (λ) are inversely related for electromagnetic radiation. The speed of light (c) connects these two properties:
Equation:
c = speed of light = 2.998 × 10⁸ m/s
λ = wavelength (μm)
ν = frequency (Hz)
As wavelength increases, frequency decreases.
Quantization of Energy
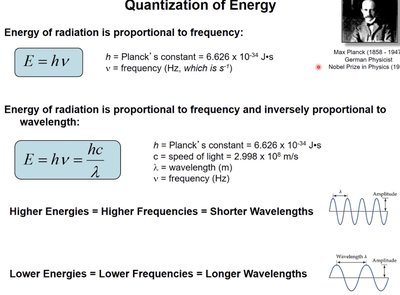
Energy of electromagnetic radiation is quantized and directly proportional to frequency. Planck's constant (h) is used to relate energy to frequency and wavelength:
Energy and frequency:
Energy and wavelength:
Higher energies correspond to higher frequencies and shorter wavelengths.
Lower energies correspond to lower frequencies and longer wavelengths.
Wavenumber (ν̅)
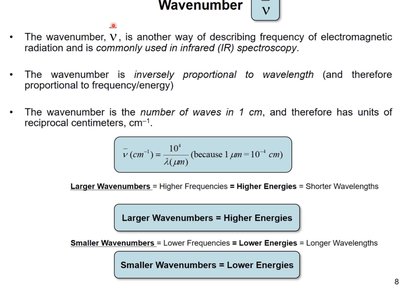
The wavenumber is another way to describe frequency, commonly used in infrared (IR) spectroscopy. It is inversely proportional to wavelength and is measured in reciprocal centimeters (cm-1).
Equation:
Larger wavenumbers = higher frequencies = higher energies = shorter wavelengths.
Smaller wavenumbers = lower frequencies = lower energies = longer wavelengths.
Examples of Spectroscopy in Organic Chemistry
Types of Spectroscopy and Their Effects
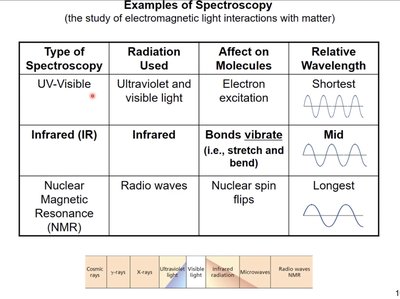
Spectroscopy is the study of electromagnetic light interactions with matter. Different types of spectroscopy use different regions of the electromagnetic spectrum and affect molecules in distinct ways.
Type of Spectroscopy | Radiation Used | Affect on Molecules | Relative Wavelength |
|---|---|---|---|
UV-Visible | Ultraviolet and visible light | Electron excitation | Shortest |
Infrared (IR) | Infrared | Bonds vibrate (stretch and bend) | Mid |
Nuclear Magnetic Resonance (NMR) | Radio waves | Nuclear spin flips | Longest |
Infrared (IR) Spectroscopy: Principles and Applications
Stretching and Bending Vibrations
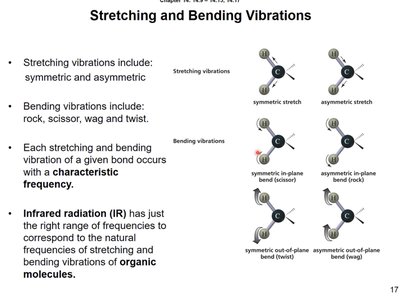
IR spectroscopy is based on the absorption of IR energy by molecular vibrations. These vibrations include stretching (symmetric and asymmetric) and bending (rock, scissor, wag, twist). Each bond vibrates at a characteristic frequency, which can be detected by IR spectroscopy.
Stretching vibrations: symmetric and asymmetric
Bending vibrations: rock, scissor, wag, twist
IR radiation matches the natural frequencies of organic bond vibrations
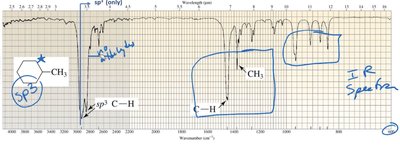
An Introduction to IR Absorption
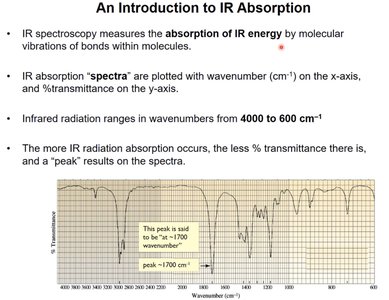
IR spectroscopy measures the absorption of IR energy by molecular vibrations. IR spectra are plotted with wavenumber (cm-1) on the x-axis and % transmittance on the y-axis. The IR region ranges from 4000 to 600 cm-1.
Absorption causes a decrease in % transmittance, resulting in a peak.
Characteristic peaks correspond to specific bond vibrations.
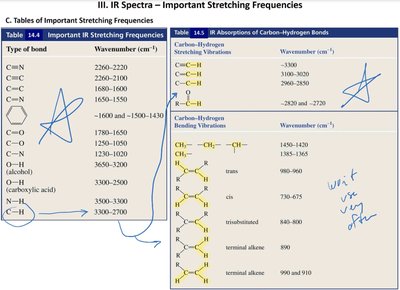
IR Absorptions: Functional Group and Fingerprint Regions
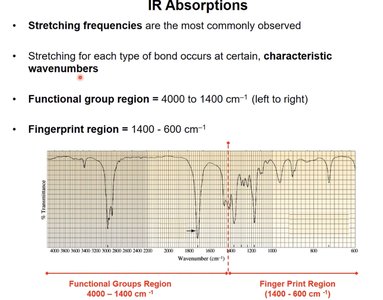
Stretching frequencies are most commonly observed in IR spectra. The spectrum is divided into two regions:
Functional group region: 4000–1400 cm-1
Fingerprint region: 1400–600 cm-1
Characteristic wavenumbers for each bond type allow identification of functional groups.
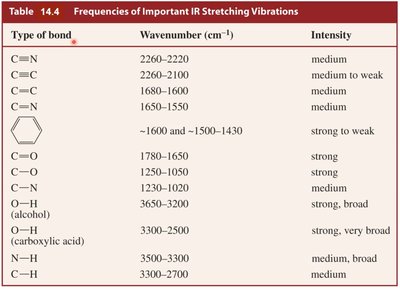
Frequencies of Important IR Stretching Vibrations
Different types of chemical bonds absorb IR radiation at characteristic wavenumbers. The intensity of absorption varies depending on the bond and its polarity.
Type of bond | Wavenumber (cm-1) | Intensity |
|---|---|---|
C≡N | 2260–2220 | medium |
C≡C | 2260–2100 | medium to weak |
C=C | 1680–1600 | medium |
C=N | 1650–1550 | medium |
Aromatic ring | ~1600 and ~1500–1430 | strong to weak |
C=O | 1780–1650 | strong |
C–O | 1250–1050 | strong |
O–H (alcohol) | 3650–3200 | strong, broad |
O–H (carboxylic acid) | 3300–2500 | strong, very broad |
N–H | 3500–3300 | medium, broad |
C–H | 3300–2700 | medium |
The Intensity of Absorption Bands
The intensity of an IR absorption band depends on the change in dipole moment during vibration. More polar bonds produce more intense absorption bands (deeper peaks).
More polar bond = more intense absorption = less % transmittance = deeper peak
Order of intensity: O–H > N–H > C–H
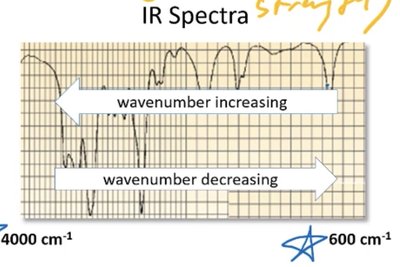
Reading IR Spectra: Wavenumber Direction
On IR spectra, wavenumber increases from right to left. Peaks at higher wavenumbers correspond to higher energy bond vibrations.
Functional Groups in Organic Chemistry
Organic compounds are classified by their functional groups, which determine their chemical properties and IR absorption characteristics.
Class | Structure |
|---|---|
Alkane | Contains only C–C and C–H bonds |
Alkene | C=C |
Alkyne | C≡C |
Nitrile | C≡N |
Alkyl halide | RX (X = F, Cl, Br, I) |
Ether | ROR |
Alcohol | ROH |
Phenol | ArOH |
Aniline | ArNH2 |
Aldehyde | RCHO |
Ketone | RCOR |
Carboxylic acid | RCOOH |
Ester | RCOOR |
Amide | RC(O)NHR |
Amine (primary) | RNH2 |
Amine (secondary) | R2NH |
Amine (tertiary) | R3N |
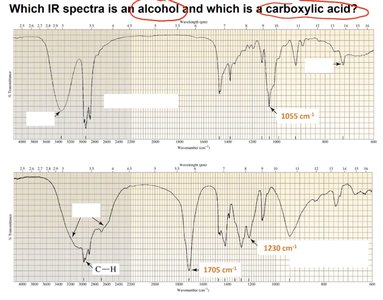
Interpreting IR Spectra: Alcohols vs. Carboxylic Acids
IR spectra can be used to distinguish between functional groups. Alcohols and carboxylic acids have characteristic O–H stretching frequencies, but carboxylic acids show a very broad O–H peak and a strong C=O peak.
Alcohol: O–H stretch (3650–3200 cm-1), strong and broad
Carboxylic acid: O–H stretch (3300–2500 cm-1), very broad; C=O stretch (~1700 cm-1), strong
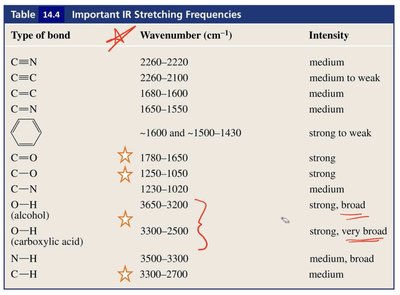
Summary Table: Important IR Stretching Frequencies
Key IR stretching frequencies for common functional groups are summarized below:
Type of bond | Wavenumber (cm-1) | Intensity |
|---|---|---|
C≡N | 2260–2220 | medium |
C≡C | 2260–2100 | medium to weak |
C=C | 1680–1600 | medium |
C=N | 1650–1550 | medium |
Aromatic ring | ~1600 and ~1500–1430 | strong to weak |
C=O | 1780–1650 | strong |
C–O | 1250–1050 | strong |
O–H (alcohol) | 3650–3200 | strong, broad |
O–H (carboxylic acid) | 3300–2500 | strong, very broad |
N–H | 3500–3300 | medium, broad |
C–H | 3300–2700 | medium |
Additional info:
IR spectroscopy is a fundamental tool for identifying functional groups in organic molecules.
Characteristic absorption bands allow chemists to deduce molecular structure.
