 Back
BackInfrared Spectroscopy and Mass Spectrometry: Structure Determination in Organic Chemistry
Study Guide - Smart Notes
 Tailored notes based on your materials, expanded with key definitions, examples, and context.
Infrared Spectroscopy and Mass Spectrometry in Organic Chemistry
Introduction to Spectroscopic Techniques
Organic chemists use several spectroscopic techniques to determine the structure of organic compounds. The four primary methods are Infrared (IR) Spectroscopy, Mass Spectrometry (MS), Nuclear Magnetic Resonance (NMR) Spectroscopy, and Ultraviolet (UV) Spectroscopy. Each technique provides unique information about molecular structure and functional groups.
IR Spectroscopy: Measures bond vibration frequencies to identify functional groups.
MS: Fragments molecules and measures mass, revealing molecular weight and functional groups.
NMR: Analyzes hydrogen environments, indicating alkyl and other functional groups.
UV: Uses electronic transitions to determine bonding patterns.
Learning Goals
Identify characteristic absorptions in IR spectra and propose likely functional groups.
Determine absent functional groups based on missing IR peaks.
Use mass spectra to determine molecular weight and elemental composition.
Predict major ions in mass spectra from fragmentation and assess structural consistency.
Infrared (IR) Spectroscopy
The IR Region and Molecular Vibrations
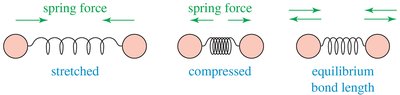
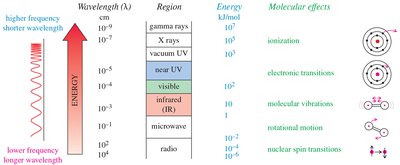
IR spectroscopy observes the vibrations of covalent bonds, providing evidence for the presence of functional groups. Two atoms joined by a covalent bond can undergo stretching vibrations, moving back and forth like a spring. The IR region typically covers wavelengths from 2.5 × 10⁻⁴ to 25 × 10–4 cm, but wavenumbers (cm–1) are more commonly used, being proportional to frequency and energy.
Bond stretching: Atoms move apart (stretched) or together (compressed) around an equilibrium bond length.
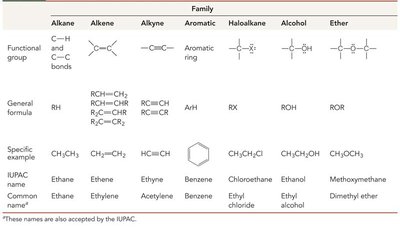
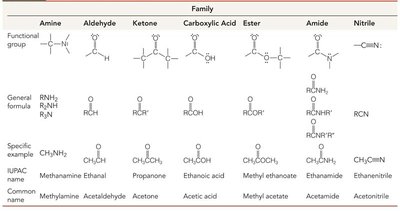
Families of Organic Compounds and Functional Groups
Organic compounds are classified by their functional groups, which determine their chemical properties and IR absorption patterns. The symbols R and Ar represent generic alkyl and aryl groups, respectively.
The Electromagnetic Spectrum and IR Region
The IR region is part of the electromagnetic spectrum, with energy levels suitable for molecular vibrations. The energy of a photon is given by:
Where is Planck’s constant ( kJ·sec)
Regions of Infrared (IR) and Frequency Trends
IR frequencies depend on atomic mass and bond energy. Heavier atoms vibrate at lower frequencies, while stronger bonds vibrate at higher frequencies. C-H bond stretching frequencies vary by hybridization: sp > sp2 > sp3.
C-H (sp): 3300 cm–1
C-H (sp2): 3000–3100 cm–1
C-H (sp3): 2800–3000 cm–1
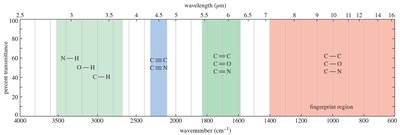
Summary of IR Stretching Frequencies
Characteristic IR frequencies for functional groups are summarized below:
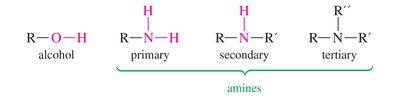
O-H and N-H Stretching in Alcohols and Amines
O-H and N-H stretching occur around 3300 cm–1, but their appearance differs:
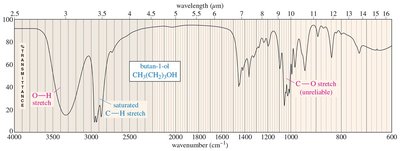
Alcohol O-H: Broad, rounded tip at 3300 cm–1
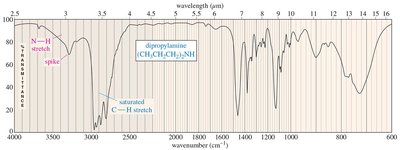
Secondary amine (R2NH): Broad with one sharp spike
Primary amine (RNH2): Broad with two sharp spikes
Tertiary amine (R3N): No signal (no hydrogen)
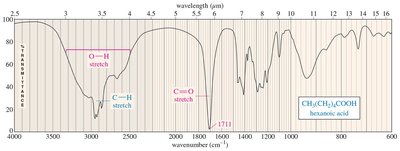
Acid O-H: Very broad, 2500–3300 cm–1
IR Spectra of Alcohols, Acids, and Amines
Alcohols show broad O-H stretching due to hydrogen bonding. Acids display both O-H and C=O stretches, while amines show N-H stretching with characteristic spikes.
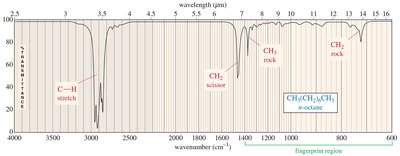
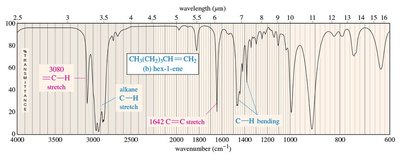
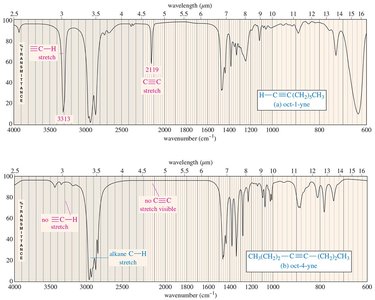
IR Spectra of Alkanes, Alkenes, and Alkynes
Alkanes show C-H and C-C stretching and bending. Alkenes display C=C stretching (1640–1680 cm–1) and unsaturated C-H stretching (3080 cm–1). Alkynes exhibit C≡C stretching (just above 2200 cm–1) and, if terminal, C≡C-H stretching (3313 cm–1).
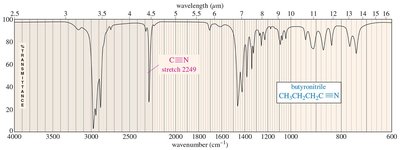
IR Spectrum of Nitriles
Nitriles have a sharp, intense absorption centered around 2200–2300 cm–1 due to the polar C≡N bond.
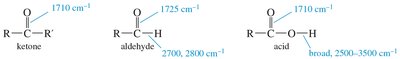
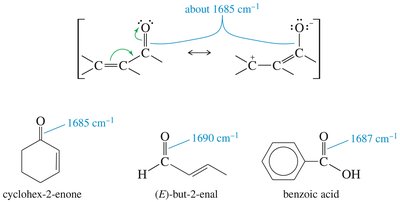
Carbonyl Group IR Absorptions
The C=O bond in ketones, aldehydes, and carboxylic acids absorbs strongly around 1710 cm–1. Aldehydes also show C-H stretches at 2700 and 2800 cm–1. Carboxylic acids display broad O-H stretches.
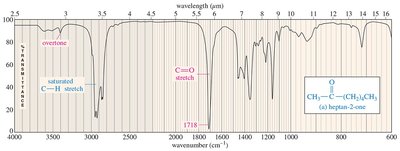
IR Spectra of Ketones, Aldehydes, and Carboxylic Acids
Ketones and aldehydes show strong C=O stretches. Aldehydes have additional C-H stretches. Carboxylic acids display both O-H and C=O stretches.

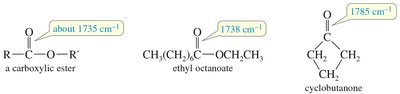
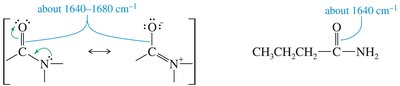
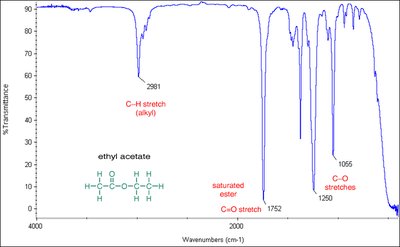
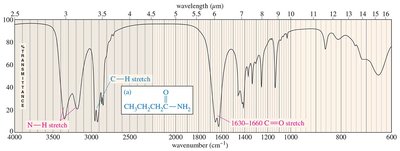
IR Spectra of Esters and Amides
Esters show C=O stretches (1750–1735 cm–1 for aliphatic, 1730–1715 cm–1 for α,β-unsaturated) and C–O stretches (1300–1000 cm–1). Amides display C=O stretches at lower frequencies (1640–1680 cm–1) due to resonance, and N-H stretches if hydrogens are present.
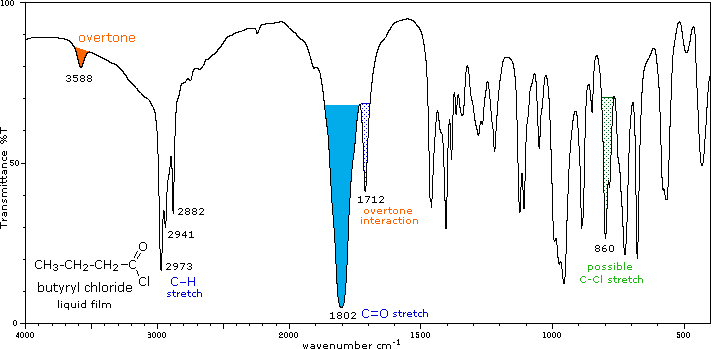
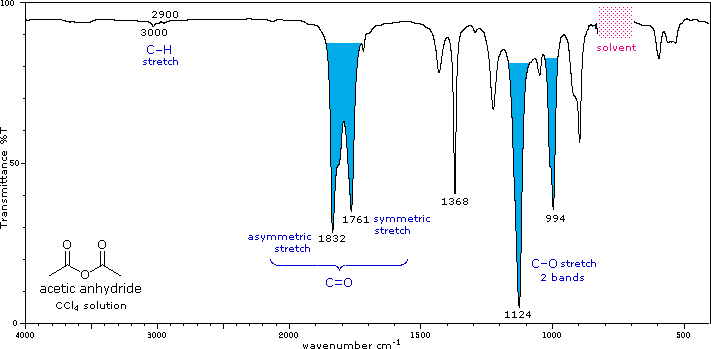
IR Spectra of Acid Chlorides and Anhydrides
Acid chlorides and anhydrides have distinctive C=O stretches and other characteristic absorptions.
Strengths and Limitations of IR Spectroscopy
IR spectroscopy is useful for identifying functional groups.
Absence of a signal confirms the absence of a functional group.
IR alone cannot determine complete structure; comparison with known spectra is required.
Mass Spectrometry (MS)
Principles of Mass Spectrometry
Mass spectrometry provides molecular weight and formula from small samples. It is a destructive technique, breaking molecules into fragments using high-energy electrons. Only positive fragments are detected.
Radical cation formation: Loss of an electron produces a radical cation ().
Fragmentation occurs at C–C or C–H bonds.
Separation and Detection of Ions
Ions are separated by magnetic deflection based on their mass-to-charge ratio (). Most ions have a +1 charge, so their path depends on mass.
Interpreting Mass Spectra
Base peak: Tallest peak, assigned 100% abundance.
Molecular ion (M+): Corresponds to molecular weight.
Fragment peaks reveal structural information.
Isotopic Patterns in Mass Spectra
Isotopes cause characteristic patterns:
Carbon: 13C isotope gives M+1 peak (1.1% abundance).
Bromine: 79Br and 81Br give equal M+ and M+2 peaks.
Chlorine: 35Cl and 37Cl give M+ peak three times higher than M+2.
Sulfur: 32S, 33S, 34S give M+2 peak about 4% of M+.
Fragmentation Patterns
Fragmentation favors formation of the most stable cation. Resonance-stabilized cations (benzylic, allylic) are common. Functional groups influence fragmentation:
Alcohols: Loss of water or alkyl groups.
Ethers: α-cleavage next to oxygen.
Amines: α-cleavage next to nitrogen.
Ketones/Aldehydes: McLafferty rearrangement and α-cleavage.
Carboxylic acids: McLafferty rearrangement and alkyl loss.
Applications and Limitations
MS is useful for determining molecular weight and formula.
High-resolution MS distinguishes compounds with similar masses.
GC–MS separates mixtures before MS analysis.
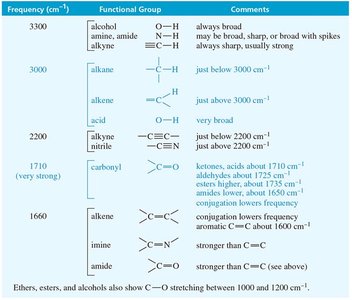
Summary Table: IR Stretching Frequencies
Frequency (cm–1) | Functional Group | Comments |
|---|---|---|
3300 | O–H (alcohol), N–H (amine, amide), C≡C–H (alkyne) | Always broad (O–H), sharp or broad with spikes (N–H), sharp (alkyne) |
3000 | C–H (alkane, alkene, acid) | Just below 3000 cm–1 (alkane), just above 3000 cm–1 (alkene), very broad (acid) |
2200 | C≡C (alkyne), C≡N (nitrile) | Just above 2200 cm–1 |
1710 (very strong) | C=O (carbonyl) | Ketones, acids about 1710 cm–1; aldehydes about 1725 cm–1; esters higher, about 1735 cm–1; conjugation lowers frequency |
1660 | C=C (alkene), C=N (imine), C=O (amide) | Conjugation lowers frequency; aromatic C=C about 1600 cm–1 |
Example: IR Spectra Interpretation
Alcohol: Broad O–H stretch at 3300 cm–1, C–H stretch at 2800–3000 cm–1
Carboxylic acid: Broad O–H stretch (2500–3500 cm–1), strong C=O stretch at 1710 cm–1
Amine: N–H stretch at 3300 cm–1 (one or two spikes), C–H stretch at 2800–3000 cm–1
Alkane: C–H stretch at 2800–3000 cm–1, no other strong bands
Alkene: C=C stretch at 1640–1680 cm–1, unsaturated C–H stretch at 3080 cm–1
Alkyne: C≡C stretch just above 2200 cm–1, terminal C≡C–H stretch at 3313 cm–1
Nitrile: C≡N stretch at 2200–2300 cm–1
Ketone/Aldehyde: C=O stretch at 1710–1725 cm–1, aldehyde C–H stretches at 2700 and 2800 cm–1
Ester: C=O stretch at 1735 cm–1, C–O stretch at 1300–1000 cm–1
Amide: C=O stretch at 1640–1680 cm–1, N–H stretch at 3300 cm–1 (if present)
Conclusion
Infrared spectroscopy and mass spectrometry are essential tools for organic structure determination. IR identifies functional groups by their characteristic absorption frequencies, while MS provides molecular weight and fragmentation patterns. Together, these techniques allow chemists to deduce the structure and composition of organic molecules.
