 Back
BackMass Spectrometry in Organic Chemistry: Principles, Interpretation, and Applications
Study Guide - Smart Notes
 Tailored notes based on your materials, expanded with key definitions, examples, and context.
Mass Spectrometry: Principles and Instrumentation
General Features of Spectroscopy
Spectroscopy is a fundamental analytical technique in organic chemistry, used to determine the chemical composition, molecular formula, and structure of compounds. The process involves exciting a sample with an external energy source, observing the resulting transformation, and analyzing the data output.
Sample: The compound, molecule, or mixture of interest.
Injector: Method for inserting the sample into the instrument.
Analyzer: Excites the sample, making it observable.
Detector: Observes the transformation and records data.
Data Output: Visual representation used to deduce chemical properties.
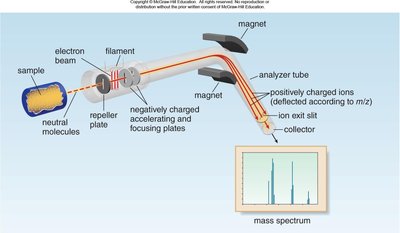
Mass Spectrometry (MS): Overview and Function
Mass spectrometry is a powerful tool for measuring the molecular weight and determining the molecular formula of organic compounds. The sample is vaporized and ionized, producing cations that are analyzed based on their mass-to-charge ratio (m/z).
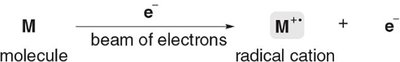
Ionization: High-energy electron beam causes the molecule to eject an electron, forming a radical cation (M+•).
Analyzer/Detector: Magnet separates cations by mass; ions travel through a tube to the detector.
Data: Plots relative abundance vs. m/z.
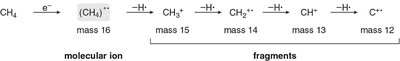
Ionization and Fragmentation
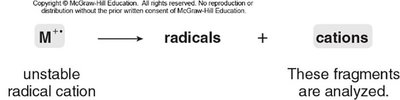
The molecular ion (M+•) is unstable and decomposes to form fragments, which are analyzed to deduce structural information.
Ionization Equation:
Fragmentation:
Interpreting Mass Spectra
Understanding Peaks in Mass Spectra
Mass spectra display peaks corresponding to ions of different masses. The base peak is the most abundant ion, while the molecular ion (M peak) represents the intact molecule.
Base Peak: The most intense peak (relative abundance = 100%).
Molecular Ion (M): Peak corresponding to the molecular weight of the compound.
M+1 Peak: Due to isotopic variants (e.g., 13C).
Fragmentation Patterns
Fragmentation occurs via loss of hydrogen atoms or other groups, producing ions of lower mass.
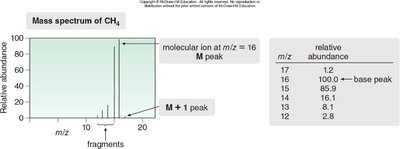
Example: Methane fragmentation produces ions at m/z = 15, 14, 13, and 12.
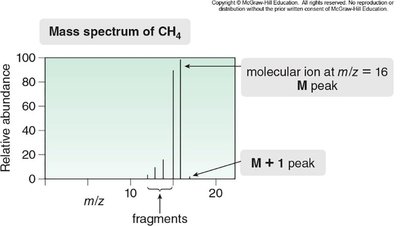
Mass Spectrum Example: Methane
The mass spectrum of methane illustrates the molecular ion at m/z = 16 and the M+1 peak at m/z = 17.
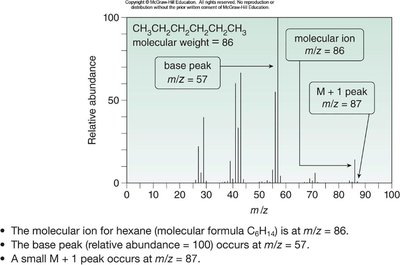
Mass Spectrum Example: Hexane
Hexane (C6H14) shows a molecular ion at m/z = 86, a base peak at m/z = 57, and fragment peaks at m/z = 43 and 29.
Isotopic Patterns and the Nitrogen Rule
The Nitrogen Rule
The nitrogen rule states that compounds with an odd number of nitrogen atoms have an odd molecular ion mass, while those with an even number have an even mass.
Hydrocarbons and C, H, O compounds: Even molecular ion mass.
Compounds with nitrogen: Odd molecular ion mass if odd number of N atoms.
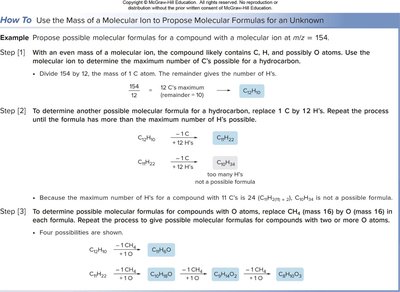
Proposing Molecular Formulas
Using Molecular Ion Mass
To propose possible molecular formulas, use the molecular ion mass and logical deduction based on atomic masses and possible atom combinations.
Step 1: Divide the molecular ion mass by 12 (mass of C) to estimate maximum number of C atoms.
Step 2: Subtract multiples of 12 and divide remainder by 1 (mass of H) for maximum H atoms.
Step 3: Adjust for O, N, or other atoms as needed.


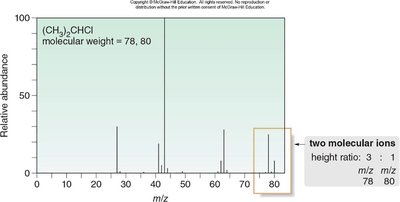
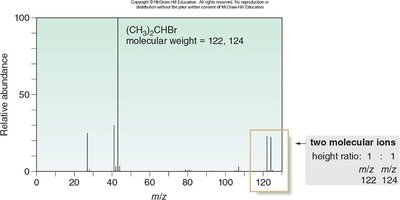
Isotopic Patterns in Alkyl Halides
Chlorine and Bromine Isotopes
Chlorine and bromine exhibit characteristic isotopic patterns in mass spectra due to their natural abundance ratios.
Chlorine: 35Cl and 37Cl in a 3:1 ratio; produces M and M+2 peaks.
Bromine: 79Br and 81Br in a 1:1 ratio; produces M and M+2 peaks of equal height.
Fragmentation Patterns in Organic Compounds
Fragmentation of Hexane
Cleavage of C–C bonds in hexane forms lower molecular weight fragments, corresponding to peaks in the mass spectrum.
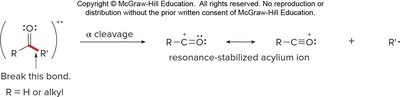
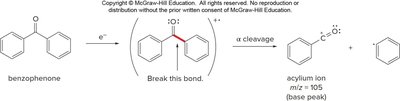
Fragmentation of Carbonyls
Aldehydes and ketones often undergo α cleavage, breaking the bond between the carbonyl carbon and an adjacent carbon, yielding a resonance-stabilized acylium ion.
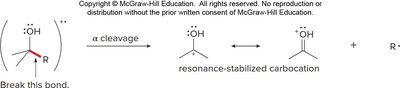
Fragmentation of Alcohols
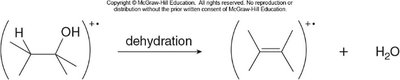
Alcohols undergo cleavage between an alkyl group and the carbon bearing the OH group, forming a resonance-stabilized carbocation. Alcohols can also undergo dehydration, forming water and a radical cation.
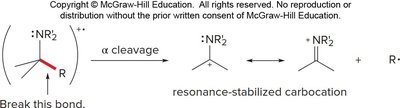
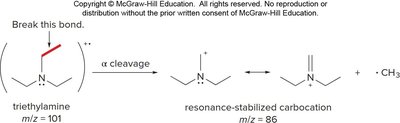
Fragmentation of Amines
Amines fragment by alpha cleavage of the bond between an alkyl group and the carbon bearing the amine nitrogen, forming an alkyl radical and a resonance-stabilized carbocation.
High Resolution Mass Spectrometry
Exact Mass Determination
High resolution mass spectrometers measure m/z ratios to several decimal places, allowing precise determination of molecular formulas based on exact isotope masses.
Isotope | Mass |
|---|---|
12C | 12.0000 |
1H | 1.00783 |
16O | 15.9949 |
14N | 14.0031 |
Example: Exact Mass Differentiation
A molecule with a molecular ion at m/z = 60 could have several possible formulas. High resolution MS distinguishes between them:
Formula | Exact Mass |
|---|---|
C3H8O | 60.0575 |
C2H4O2 | 60.0211 |
C2H8N2 | 60.0688 |
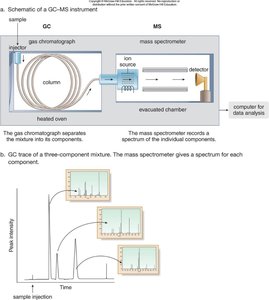
Gas Chromatography–Mass Spectrometry (GC-MS)
Principle and Function
GC-MS combines gas chromatography and mass spectrometry to analyze mixtures. The GC separates components by boiling point, and the MS records spectra for each component.
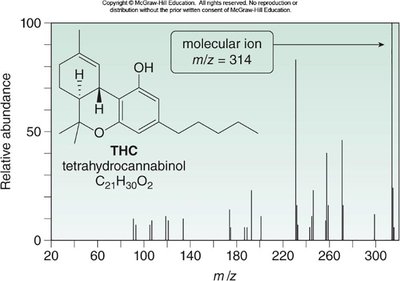
Application Example: THC Analysis
GC-MS can be used to analyze biological samples for organic compounds such as tetrahydrocannabinol (THC). The mass spectrum of THC shows a molecular ion at m/z = 314.
Summary Table: Key Mass Spectrometry Concepts
Concept | Description |
|---|---|
Molecular Ion (M) | Peak representing the intact molecule |
Base Peak | Most intense peak (relative abundance = 100%) |
M+1 Peak | Peak due to isotopic variants (e.g., 13C) |
Fragmentation | Breakdown of molecular ion into smaller ions |
Nitrogen Rule | Odd molecular ion mass indicates odd number of N atoms |
Isotopic Patterns | Characteristic M and M+2 peaks for Cl and Br |
High Resolution MS | Determines exact mass for precise formula identification |
GC-MS | Separates and analyzes mixtures of compounds |
Additional info: These notes expand on the original slides and images, providing academic context, definitions, and examples for clarity and completeness.
