 Back
BackMass Spectrometry, Infrared Spectroscopy, and Ultraviolet/Visible Spectroscopy: Principles and Applications
Study Guide - Smart Notes
 Tailored notes based on your materials, expanded with key definitions, examples, and context.
Mass Spectrometry
Principles of Mass Spectrometry
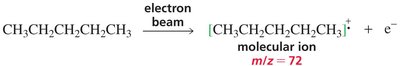
Mass spectrometry is an analytical technique used to determine the molecular mass and structural features of organic compounds by measuring the mass-to-charge ratio (m/z) of ionized fragments.
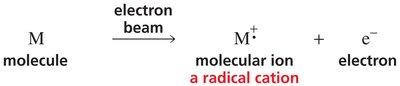
Ionization: A molecule (M) is bombarded with an electron beam, resulting in the loss of an electron and formation of a molecular ion (M+•), which is a radical cation.
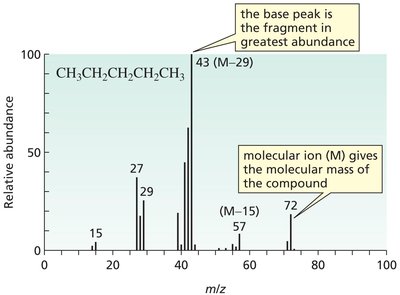
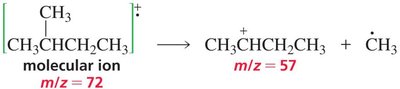
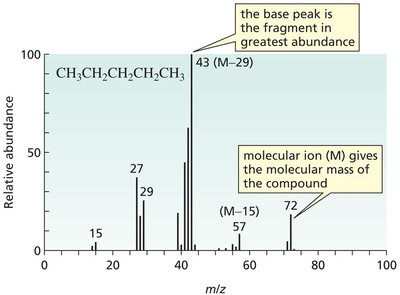
Fragmentation: The molecular ion can fragment into smaller ions and neutral species, with the most stable fragments appearing as the most abundant peaks in the spectrum.
Base Peak: The most intense peak in the spectrum, corresponding to the most stable and abundant fragment.
Molecular Ion Peak (M): Indicates the molecular mass of the compound.
Fragmentation Patterns
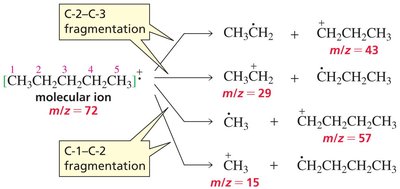
Fragmentation occurs at specific bonds, often producing characteristic ions that help identify the structure of the molecule.
C–C Bond Cleavage: Fragmentation between carbon atoms can yield ions with different m/z values, depending on the stability of the resulting carbocations.
Stability of Fragments: More stable carbocations (e.g., secondary over primary) lead to more abundant peaks.
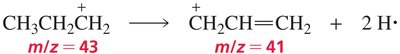
Loss of Small Molecules: Fragments may lose small neutral molecules (e.g., H2), resulting in additional peaks.
Mass Spectra of Alkanes and Isomers
Isomeric compounds can be distinguished by their fragmentation patterns and the relative abundance of peaks.
Pentane vs. Isopentane: Isopentane shows a more abundant peak at m/z = 57 due to the formation of a more stable secondary carbocation compared to pentane.
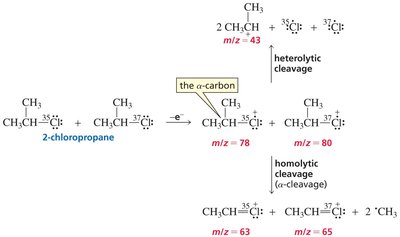
Mass Spectra of Alkyl Halides
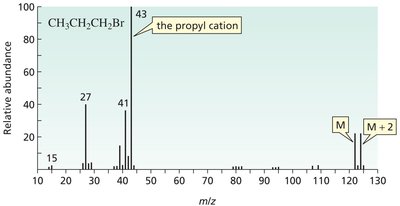
Alkyl halides show characteristic isotopic patterns due to the presence of halogen isotopes.
Bromine: 79Br and 81Br are nearly equally abundant, resulting in two molecular ion peaks (M and M+2) of similar intensity.
Chlorine: 35Cl is three times more abundant than 37Cl, so the M+2 peak is about one-third the intensity of the M peak.
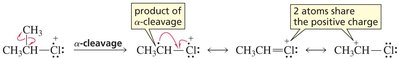
Fragmentation: Both heterolytic and homolytic cleavages are observed, with α-cleavage being common.

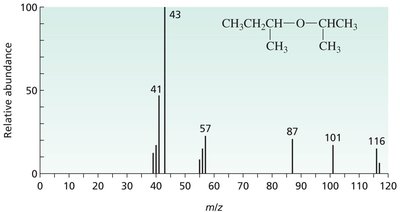
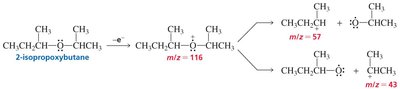
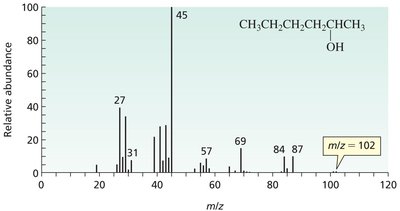
Mass Spectra of Ethers, Ketones, and Alcohols
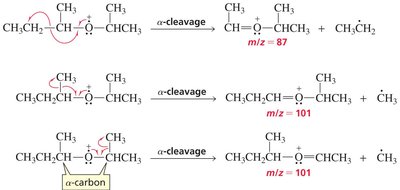
Characteristic fragmentation patterns are observed for ethers, ketones, and alcohols, often involving α-cleavage and rearrangements.
Ethers: α-cleavage leads to the formation of alkoxy and alkyl fragments.
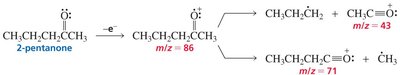
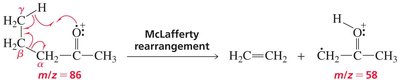
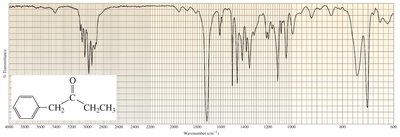
Ketones: α-cleavage and McLafferty rearrangement are common, producing resonance-stabilized ions.
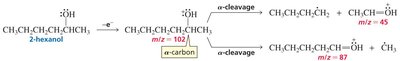
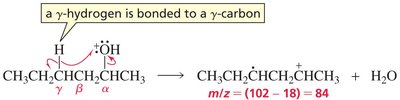
Alcohols: α-cleavage and loss of water (if a γ-hydrogen is present) are typical fragmentation pathways.
Summary Table: Common Fragmentation Behavior
Compound Type | Bond Cleavage | Fragmentation Feature |
|---|---|---|
Alkanes | Homolytic (C–C) | Stable carbocations |
Alkyl halides | Heterolytic (C–X) | Isotopic peaks, α-cleavage |
Ethers | Homolytic/heterolytic (C–O) | α-cleavage |
Alcohols | Heterolytic (C–O), loss of H2O | α-cleavage, dehydration |
Ketones | Homolytic (α-cleavage) | McLafferty rearrangement |
Infrared (IR) Spectroscopy
Principles of IR Spectroscopy
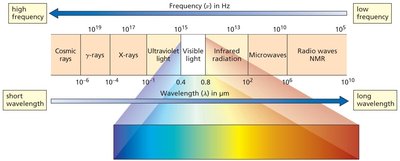
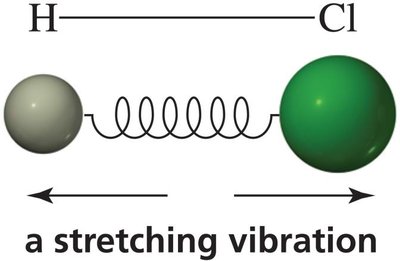
Infrared spectroscopy is used to identify functional groups in organic molecules by measuring the absorption of IR radiation, which causes molecular vibrations.
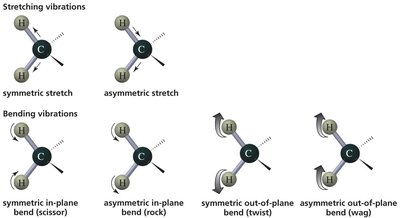
Vibrational Modes: Stretching and bending of bonds occur at characteristic frequencies (wavenumbers, cm–1).
IR Active Vibrations: Only vibrations that result in a change in dipole moment are IR active.
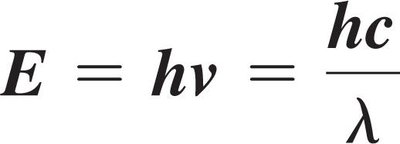
Energy Relationships: The energy of IR radiation is related to frequency and wavelength by .
Characteristic IR Absorptions
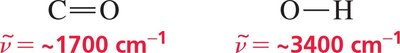
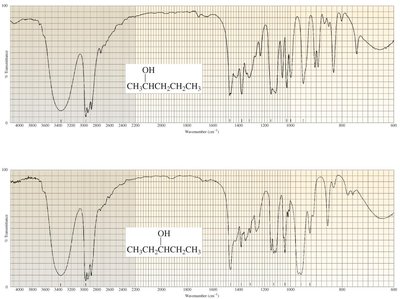
Each functional group absorbs IR radiation at a specific wavenumber, allowing for identification of molecular structure.
Functional Group Region: 4000–1400 cm–1 (identifies functional groups).
Fingerprint Region: 1400–600 cm–1 (unique to each molecule).
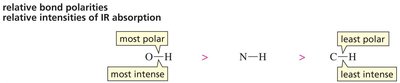
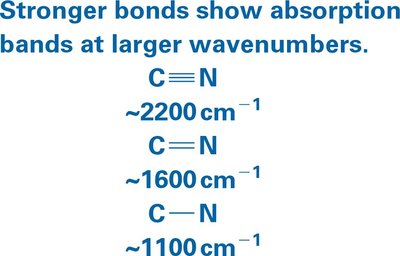
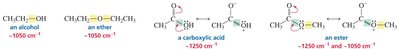
Bond Polarity and Order: More polar and stronger bonds absorb at higher wavenumbers and with greater intensity.
Effects on IR Absorption
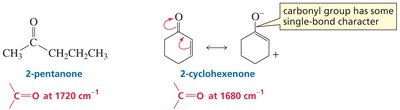
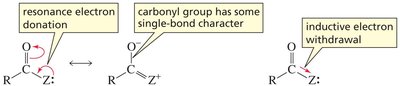
Resonance: Electron delocalization lowers the frequency of absorption (e.g., conjugated carbonyls absorb at lower wavenumbers).
Inductive Effects: Electron-withdrawing groups increase absorption frequency.
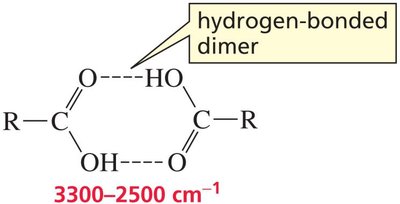
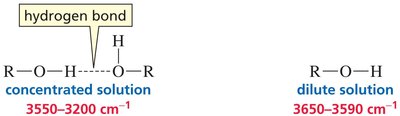
Hydrogen Bonding: Hydrogen-bonded O–H stretches appear at lower frequencies and are broader.
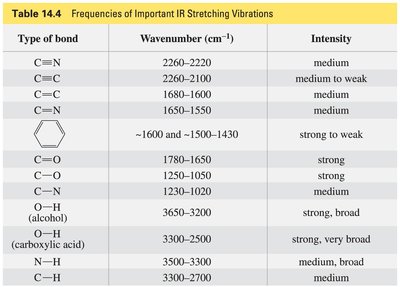
Summary Table: Important IR Stretching Vibrations
Type of Bond | Wavenumber (cm–1) | Intensity |
|---|---|---|
C≡N | 2260–2220 | medium |
C≡C | 2260–2100 | medium to weak |
C=C | 1680–1600 | medium |
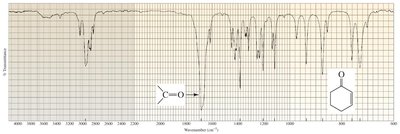
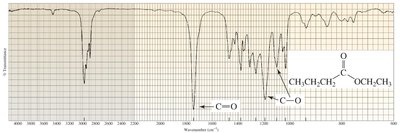
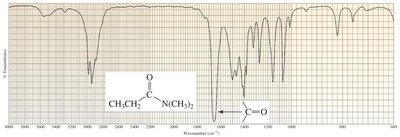
C=O | 1780–1650 | strong |
O–H (alcohol) | 3650–3200 | strong, broad |
N–H | 3500–3300 | medium, broad |
C–H | 3300–2700 | medium |
Ultraviolet/Visible (UV/Vis) Spectroscopy
Principles of UV/Vis Spectroscopy
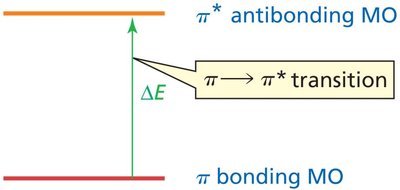
UV/Vis spectroscopy is used to study compounds with conjugated π systems by measuring the absorption of ultraviolet or visible light, which promotes electrons to higher energy levels.
Chromophore: The part of a molecule responsible for light absorption in the UV/Vis region.
Electronic Transitions: π → π* and n → π* transitions are common in organic molecules.
Conjugation: Increased conjugation shifts absorption to longer wavelengths (lower energy).
Beer–Lambert Law: The absorbance (A) is proportional to concentration (c), path length (l), and molar absorptivity (ε):
Summary Table: UV/Vis Absorption
Region | Wavelength (nm) | Application |
|---|---|---|
UV | 100–400 | π systems, conjugated dienes |
Visible | 400–700 | Colored compounds |
Auxochrome
An auxochrome is a substituent that modifies the position and intensity of absorption by a chromophore, often by extending conjugation or donating electrons.
