 Back
BackSpectrometry and Spectroscopy: Analytical Techniques in Organic Chemistry
Study Guide - Smart Notes
 Tailored notes based on your materials, expanded with key definitions, examples, and context.
Spectrometry and Spectroscopy in Organic Chemistry
Introduction to Analytical Techniques
Organic chemists use spectrometry and spectroscopy to identify unknown compounds, assess purity, and analyze mixtures. These methods are essential for quality control in pharmaceuticals, supplements, cosmetics, environmental samples, and even art conservation. The ability to determine molecular structure and composition is foundational for organic chemistry research and industry applications.
Spectroscopy: Analytical methods based on the interaction of molecules with electromagnetic waves.
Spectrometry: Broader analytical methods, often not limited to EM waves, including mass spectrometry.
Applications: Drug purity, supplement contents, cosmetic composition, pesticide detection, hydrocarbon analysis, pigment identification.


Types of Spectroscopic and Spectrometric Techniques
Overview of Methods
Several key analytical techniques are used in organic chemistry to determine molecular structure and composition:
Mass Spectrometry (MS): Determines molecular mass and fragmentation patterns.
Infrared (IR) Spectroscopy: Identifies functional groups based on bond vibrations.
Nuclear Magnetic Resonance (NMR) Spectroscopy: Reveals detailed structural information about hydrogen and carbon environments.
Mass Spectrometry
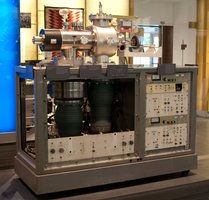
Principles and Instrumentation
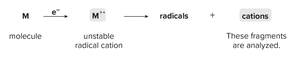
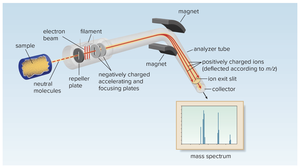
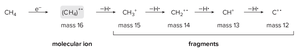
Mass spectrometry is a powerful technique for identifying the molecular mass of compounds and their fragmentation patterns. Molecules are ionized, typically by electron bombardment, forming radical cations that fragment into smaller ions. These ions are separated based on their mass-to-charge ratio (m/z) and detected.
Ionization: Molecules are bombarded with electrons, forming unstable radical cations.
Fragmentation: Radical cations break into smaller cationic fragments.
Detection: Ions are deflected by a magnet and detected according to their m/z ratio.
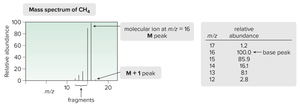
Mass Spectrum Interpretation
The mass spectrum is a graphical readout showing the abundance of detected ions versus their m/z ratio. The molecular ion peak (M) indicates the molecular mass, while other peaks correspond to fragment ions.
Molecular Ion Peak (M): Represents the intact molecule.
Fragment Peaks: Indicate structural features and fragmentation pathways.
High-Resolution Mass Spectrometry
Modern MS instruments can distinguish small differences in atomic mass, allowing precise determination of molecular formulae. This is crucial for identifying unknown compounds and differentiating isomers.
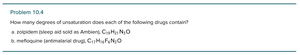
Degrees of Unsaturation
Calculating Degrees of Unsaturation
Degrees of unsaturation indicate the presence of rings or pi bonds in a molecule. The formula is:
Formula: , where n = number of C atoms.
Heteroatom Adjustments: X (F, Cl, Br, I): add 1 to H; O: ignore; N: subtract 1 from H.
Structural Implications
Each degree of unsaturation corresponds to a ring or a pi bond. This calculation is essential for deducing possible structures from molecular formulae.
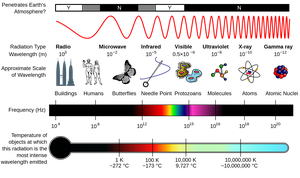
Electromagnetic Spectrum and Photon Properties
Electromagnetic Radiation in Spectroscopy
Electromagnetic radiation spans a wide range of wavelengths, from radio waves to gamma rays. Spectroscopic techniques utilize specific regions (IR, UV-Vis, NMR, X-ray) to probe molecular properties.
Wavelength (λ): Distance between wave crests.
Frequency (ν): Number of waves passing a point per second.
Key Equations: (speed of light), (energy of photon).
Wavenumber in IR Spectroscopy
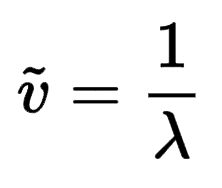
Wavenumber () is used in IR spectroscopy and is defined as the reciprocal of wavelength:
Formula:
IR region: 4000–40 cm-1
Photon-Molecule Interactions
Energy Absorption and Quantized States
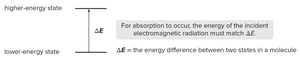
Molecules absorb photons when the energy matches the difference between quantized energy states. This absorption is unique to each molecule and forms the basis for spectroscopic identification.
Energy Difference: must match photon energy for absorption.
Infrared (IR) Spectroscopy
Vibrational Modes and IR Absorption
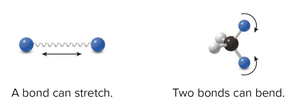
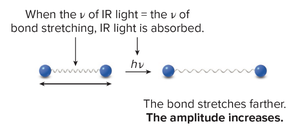
Covalent bonds vibrate at characteristic frequencies. IR light can cause these vibrations if the frequency matches the bond's vibrational mode, especially if the vibration changes the dipole moment.
Stretching: Change in bond length.
Bending: Change in bond angle.
Hooke’s Law and Bond Vibrations
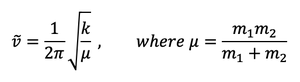
Bond vibration frequencies can be modeled using Hooke’s law, treating bonds as springs between atoms. The frequency depends on bond strength (force constant, k) and reduced mass (μ):
Formula: , where
Bond Strength and s Character
For equivalent atoms, bond strength and IR absorption depend on the s character of the carbon atom:
sp3 C–H: 25% s character
sp2 C–H: 33% s character
sp C–H: 50% s character
Higher s character = stronger bond = higher wavenumber

IR Spectrum Regions
The IR spectrum is divided into the functional group region (>1500 cm-1) and the fingerprint region (<1500 cm-1). Functional group region is most useful for identifying common organic functional groups.
Characteristic IR Absorptions
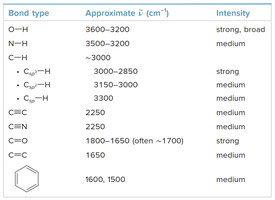
Bonds have predictable regions in IR spectra based on their strength and atomic mass. The table below summarizes key absorptions:
Bond type | Approximate (cm-1) | Intensity |
|---|---|---|
O–H | 3600–3200 | strong, broad |
N–H | 3500–3200 | medium |
C–H (sp3) | 3000–2850 | strong |
C–H (sp2) | 3150–3000 | medium |
C–H (sp) | 3300 | medium |
C≡C | 2250 | medium |
C≡N | 2250 | medium |
C=O | 1800–1650 (often ~1700) | strong |
C=C | 1650 | medium |
Benzene ring | 1600, 1500 | medium |
Nuclear Magnetic Resonance (NMR) Spectroscopy
Principles of NMR
NMR spectroscopy relies on the quantum property of nuclear spin. NMR-active nuclei (e.g., 1H, 13C) align with or against an external magnetic field. Radiofrequency radiation causes nuclei to flip between energy states, and the emitted energy is detected.
Spin: Nuclei with odd numbers of protons/neutrons have spin.
Magnetic Field (B0): Nuclei align with or against the field.
Resonance: Absorption of RF radiation causes spin flip.
NMR Spectra Interpretation
1H NMR spectra provide information about the number of hydrogen environments, their relative amounts, chemical shifts, and splitting patterns. Chemical shift (δ) is measured in parts-per-million (ppm) relative to tetramethylsilane (TMS).
Number of signals: Groups of equivalent hydrogens.
Integration: Relative amounts of each group.
Chemical shift: Chemical environment of group.
Splitting: Neighboring hydrogen atoms.
Equivalent Protons
Protons are equivalent if they are in the same chemical environment. Homotopic and enantiotopic protons are equivalent, while diastereotopic and heterotopic protons are not.
Shielding and Deshielding
Electron density around a nucleus affects its chemical shift. Increased electron density shields the nucleus (upfield), while electron-withdrawing groups deshield it (downfield).
Magnetic Anisotropy
Conjugated systems and aromatic rings exhibit magnetic anisotropy, affecting chemical shifts. Aromatic protons are highly deshielded (δ ~7.3 ppm), alkenes (δ ~5.3 ppm), and alkynes (δ ~2.0 ppm).
Spin-Spin Splitting in NMR
Splitting Patterns and Coupling Constants
Spin-spin splitting occurs when non-equivalent protons are on the same or adjacent carbon atoms. The number of peaks follows the n+1 rule, where n is the number of neighboring protons.
Coupling constant (J): Frequency difference between split peaks (Hz).
Splitting rules: Equivalent protons do not split each other; n non-equivalent protons split a signal into n+1 peaks.
Complex Splitting Patterns
Multiple groups of non-equivalent protons can cause complex splitting patterns, especially in flexible alkyl chains and alkenes.
Solving for Unknowns Using IR and NMR
Strategy for Structure Elucidation
To identify unknown compounds, follow a systematic approach:
Calculate degrees of unsaturation (rings and pi bonds).
Examine IR peaks for functional groups.
Count NMR peaks for different proton environments.
Measure peak integrals for relative proton counts.
Analyze splitting patterns for neighboring protons.
Use chemical shift to connect structural fragments.
Summary Table: IR Functional Group Absorptions
Bond type | Approximate (cm-1) | Intensity |
|---|---|---|
O–H | 3600–3200 | strong, broad |
N–H | 3500–3200 | medium |
C–H (sp3) | 3000–2850 | strong |
C–H (sp2) | 3150–3000 | medium |
C–H (sp) | 3300 | medium |
C≡C | 2250 | medium |
C≡N | 2250 | medium |
C=O | 1800–1650 (often ~1700) | strong |
C=C | 1650 | medium |
Benzene ring | 1600, 1500 | medium |
Additional info: These notes expand on the original content by providing definitions, formulas, and context for each analytical technique, making them suitable for exam preparation in a college-level organic chemistry course.
