
Textbook Question
"Finding a Critical F-Value for a Right-Tailed Test In Exercises 5–8, find the critical F-value for a right-tailed test using the level of significance α and degrees of freedom d.f.N and d.f.D.
α=0.025, d.f.N=7, d.f.D=3"
70
views

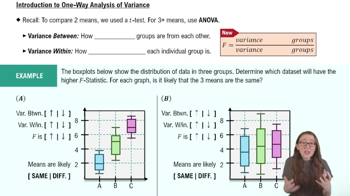
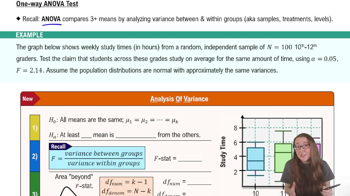
 Verified step by step guidance
 06:46
06:46
 05:31 05:31
"Finding a Critical F-Value for a Right-Tailed Test In Exercises 5–8, find the critical F-value for a right-tailed test using the level of significance α and degrees of freedom d.f.N and d.f.D.
α=0.025, d.f.N=7, d.f.D=3"
In each exercise,
c. find the test statistic,
In Exercises 1 and 2, use the table, which lists the distribution of educational achievement for people in the United States ages 25 and older. It also lists the results of a random survey for two additional age groups. (Adapted from U.S. Census Bureau)
Use the data for 30- to 34-year-olds and 65- to 69-year-olds to test whether age and educational attainment are related. Use α=0.01.
Performing a Chi-Square Goodness-of-Fit Test
In Exercises 7–16, (a) identify the claim and state H₀ and Hₐ, (b) find the critical value and identify the rejection region, (c) find the chi-square test statistic, (d) decide whether to reject or fail to reject the null hypothesis, and (e) interpret the decision in the context of the original claim.
Homicides by Month A researcher claims that the number of homicide crimes in California by month is uniformly distributed. To test this claim, you randomly select 2000 homicides from a recent year and record the month when each happened. The table shows the results. At α=0.10, test the researcher’s claim. (Adapted from California Department of Justice)
In each exercise,
b. find the critical value and identify the rejection region,
In Exercises 1 and 2, use the table, which lists the distribution of educational achievement for people in the United States ages 25 and older. It also lists the results of a random survey for two additional age groups. (Adapted from U.S. Census Bureau)
Use the data for 30- to 34-year-olds and 65- to 69-year-olds to test whether age and educational attainment are related. Use α=0.01.
In each exercise,
d. decide whether to reject or fail to reject the null hypothesis, and
e. interpret the decision in the context of the original claim.
In Exercises 1 and 2, use the table, which lists the distribution of educational achievement for people in the United States ages 25 and older. It also lists the results of a random survey for two additional age groups. (Adapted from U.S. Census Bureau)
Use the data for 30- to 34-year-olds and 65- to 69-year-olds to test whether age and educational attainment are related. Use α=0.01.
In each exercise,
e. interpret the decision in the context of the original claim.
[APPLET] In Exercises 3 and 4, use the data, which list the annual wages (in thousands of dollars) for randomly selected individuals from three metropolitan areas. Assume the wages are normally distributed and that the samples are independent. (Adapted from U.S. Bureau of Economic Analysis)
Ithaca, NY: 53.0, 60.3, 34.6, 37.1, 46.6, 46.8, 41.4, 50.6, 50.8, 49.4, 35.0, 36.7, 57.1
Little Rock, AR: 50.7, 43.7, 53.4, 40.0, 45.2, 52.7, 35.2, 60.4, 40.0, 45.9, 45.7, 47.3, 46.5, 44.5, 31.5
Madison, WI: 62.4, 53.9, 67.6, 52.9, 67.7, 50.7, 62.1, 58.9, 61.1, 65.0, 60.4, 59.6, 51.3, 44.8, 66.2
Are the mean annual wages the same for all three cities? Use α=0.10. Assume that the population variances are equal.